3:30 p.m. New York time
Half an hour before the closing bell. The S&P 500 futures rose during the session, from the 4770s to the 4820s. The middle subwave, wave B, within the 2nd-wave upward correction that began on January 5 is in the second of three subwaves.
This morning’s analysis stands unchanged.
I’ve updated the chart.
9:35 a.m. New York time
What’s happening now? The S&P 500 E-mini futures whipsawed sharply after the latest Consumer Price Index showed that inflation rose in December. The futures price rose to 4837 and then fell to 4802.50 within a 2-minute span before settling in the 4820s.
What does it mean? The rise and subsequent fall brought the price of the ongoing 2nd-wave upward correction to within four points of the end of the preceding 1st wave. Under the rules of Elliott Wave Theory, a 2nd wave never moves beyond the endpoint of the 1st wave that came before.
On the chart, I’m treating the peak as the end of the first subwave of the correction, wave A, and the decline that followed as the early steps of the correction’s declining middle subwave, wave B.
The correction is taking the form of a Zigzag, with the A-wave having five subwaves, the B-wave three and the C-wave five. The B wave typically retraces 38% to 79% of the preceding A wave, giving a price target of roughly between 4786 and 4731.
I’ve marked the price target boundaries on the chart in red.
The fact that the A-wave came so close to the start of the upper boundary of the correction provides little room for the correction’s final subwave, wave C, to reach new highs. It sometimes happens that C waves fall short, a condition called “truncation” by Elliotticians.
The 2nd-wave correction discussed above is relatively small. Encompassing it in its entirely to a much larger declining 3rd wave that began on December 27, 2023 and that will carry the price below the start of the large 2nd wave that preceded it, from 3502, and most likely significantly below that level.
Within the fractal structure of the price movements, that larger 3rd wave is four degrees smaller than the small 2nd-wave upward correction now in progress.
What are the alternatives? There are two, unchanged from yesterday.
Alternative #1: The 2nd wave rise that preceded the 3rd wave is still underway and is taking a compound form. The present decline is an X wave, which will link the first corrective pattern within wave 2 to a second corrective pattern. A compound correction contains up to three corrective patterns.
Alternative #2: This is more of a general observation. Assigning a degree to subwaves early in a correction is, frankly, little more than an educated guess. The degrees I’ve assigned may change over time as the downtrend progresses.
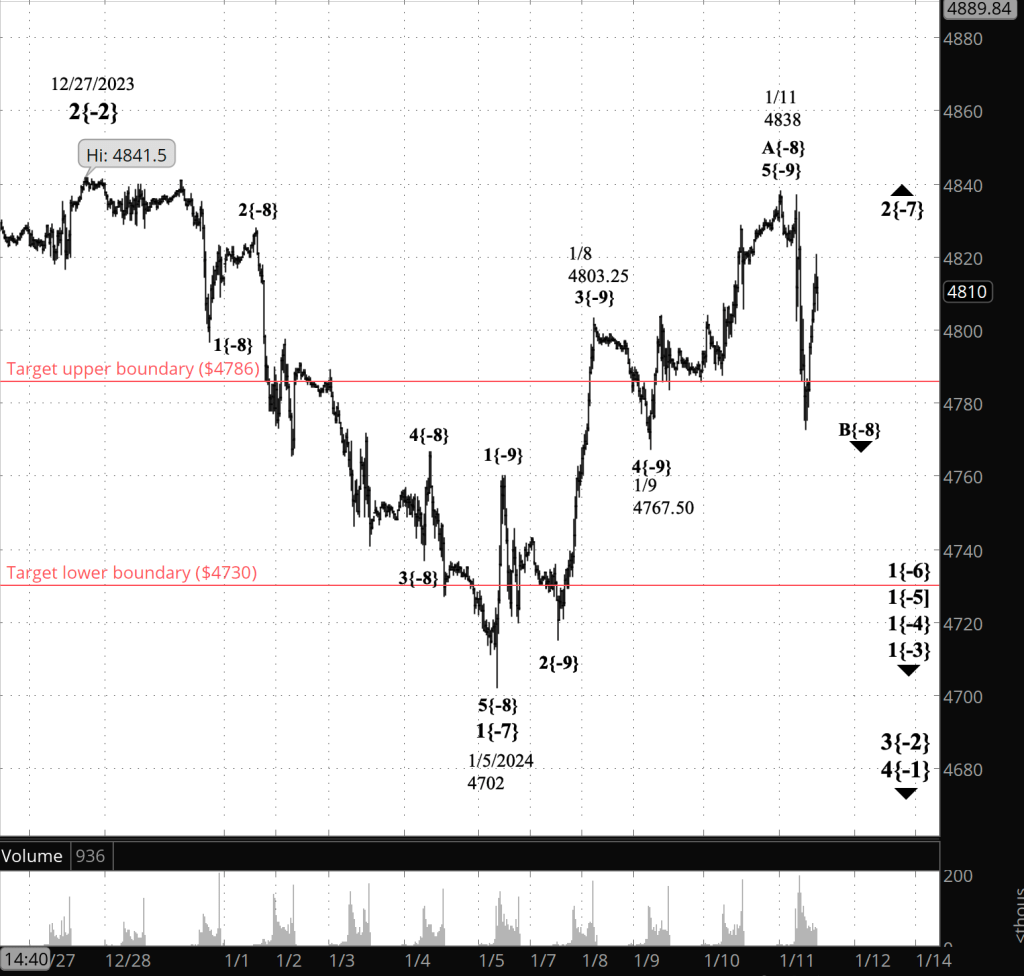
[S&P 500 E-mini futures at 3:30 p.m., 25-minute bars, with volume]
What does Elliott wave theory say? Here are the waves that underly the analyses.
Principal Analysis:
- Wave 5{0}, an expanding Diagonal Triangle, began on December 26, 2018.
- Within it, a downtrend, wave 4{-1}, began on January 4, 2022 and is underway.
- Wave 4{-1} is the parent wave of a downtrend, wave 3{-2}, that began on January 2, 2024 and is in wave 1{-3}, the first of five subwaves.
- Deep within that downtrend’s 1st wave, downtrending wave 5{-8} and its parent, wave 1{-7}, ended at the overnight low, 4702. Wave 2{-7} is now underway, an upward correction of low degree, and within it, declining wave B{-8} is underway and is within the first, wave A{-9}, of three subwaves.
Alternative #1:
- Wave 2{-2}, an upward correction that began on October 13, 2022, continues and is taking a compound form.
- Wave X{-3} is underway, connecting the now complete first corrective pattern and the not-yet-begun second corrective pattern.
Alternative #2:
The upward correction that began on January 5, labeled on the chart was wave 2{-7}, is actually wave 2{-6}, or perhaps wave 2{-5}, or maybe even larger.
We Are Here.
These are the waves currently in progress under my principal analysis. Each line on the list shows the wave number, with the subscript in curly brackets, the traditional degree name, the starting date, the starting price of the S&P 500 E-mini futures, and the direction of the wave.
- S&P 500 Index:
- 5{+3} Supercycle, 7/8/1932, 4.40 (up)
- 5{+2} Cycle, 12/9/1974, 60.96 (up)
- 5{+1} Primary, 3/6/2009, 666.79 (up)
- 5{0} Intermediate, 12/26/2018, 2346.58 (up)
- S&P 500 Futures and index:
- 4{-1} Minor, 1/4/2022, 4953.25 (down) (futures), 4818.62 (down) (index)
- S&P 500 Futures:
- 3{-2} Minute, 12/27/2023, 4841.50 (down)
- 1{-3} Minuette, 12/27/2023, 4841.50 (down)
Reading the chart. Price movements — waves – – in Elliott wave analysis are labeled with numbers within trending waves and letters with corrective waves. The subscripts — numbers in curly brackets — designate the wave’s degree, which, in Elliott wave analysis, means the relative position of a wave within the larger and smaller structures that make up the chart. R.N. Elliott, who in the 1930s developed the form of analysis that bears his name, viewed the chart as a complex structure of smaller waves nested within larger waves, which in turn are nested within still larger waves. In mathematics it’s called a fractal structure, where at every scale the pattern is similar to the others.
Learning and other resources. Elliott wave analysis provides context, not prophecy. As the 20th century semanticist Alfred Korzybski put it in his book Science and Sanity (1933), “The map is not the territory … The only usefulness of a map depends on similarity of structure between the empirical world and the map.” And I would add, in the ever-changing markets, we can judge that similarity of structure only after the fact.
See the menu page Analytical Methods for a rundown on where to go for information on Elliott wave analysis.
By Tim Bovee, Portland, Oregon, January 11, 2024
Disclaimer
Tim Bovee, Private Trader tracks the analysis and trades of a private trader for his own accounts. Nothing in this blog constitutes a recommendation to buy or sell stocks, options or any other financial instrument. The only purpose of this blog is to provide education and entertainment.
No trader is ever 100 percent successful in his or her trades. Trading in the stock and option markets is risky and uncertain. Each trader must make trading decisions for his or her own account, and take responsibility for the consequences.
License
All content on Tim Bovee, Private Trader by Timothy K. Bovee is licensed under a Creative Commons Attribution-ShareAlike 4.0 International License.
Based on a work at www.timbovee.com.

You must be logged in to post a comment.