3:30 p.m. New York time
Half an hour before the closing bell. The S&P 500 futures continued to fall during the session, reaching into the 4740s as the closing bell approached. This morning’s analysis is unchanged. I’ve updated the chart.
1:40 p.m. New York time
Trades. I exited my short Iron Fly 1DTE positions on XSP and QQQ, hour before expiration. Both positions showed a loss, XSP of 13.1% and QQQ of -25.3%. I’ve updated the trade analyses with full results.
The short Iron Fly strategy for 1DTE trades is based on declining volatility. For each of these symbols, the Implied Volatility Rate (IVR) rose sharply.
My rule of thumb for 1DTE trades using the short Iron Fly is that the IVR must be 20 or below. QQQ and XSP no longer qualify for the strategy. Neither does SPY, which now has an IVR above 26%.
So that brings what had been a productive strategy to a halt, for now at least. The longer term strategies, which rely on a high IVR for entry (roughly 25% or above) remain, as do earnings plays, and it could be that options with weekly expirations may be open for 1DTE trades. But 1DTE daily expiration symbols are now off the table.
9:35 a.m. New York time
What’s happening now? The S&P 500 E-mini futures drifted lower overnight, from 4800 plus change to the 4760s.
What does it mean? The 2nd-wave upward correction that began on January 5 is in its 2nd subwave, wave B, which is nearing its end.
In the discussion that follows I’ll need to use the wave numbers and degree numbers in order to cut through the complexity of the chart’s fractal structure. A fractal structure means that large waves encompass smaller waves, which in turn are built from still smaller waves, and whatever the level, the degree, the waves all follow the same rules and form the same patterns.
The degree number, a subscript in curly brackets, shows a wave’s position within the waves of various levels. The degree subscripts are negative because they are subwaves of wave 5{0}, the years-long 5th wave that began on December 26, 2018 and is taking the form of an expanding Diagonal Triangle. The triangle will have five subwaves and is presently in downward wave 4{-1}, its next-to-the-last subwave. And that sets the scene for what appears on the chart below.
The chart tracks wave 3{-2}, a downtrend that began on December 27, 2023 that is in its initial subwave, wave 1{-3}. Move four degrees lower, and we find the wave that has dominated the chart since it began on January 5: Wave 2{-7}, an upward correction that is taking the form of a Zigzag.
The Zigzag will have three subwaves and is presently in downward wave B{-8}, the middle subwave of the trio. Wave B{-8} will have three subwaves and is presently in the last of the three: Downward wave C{-9}. One degree smaller and we find that wave C{-9} is in the last of five subwaves, downtrending wave 5{-10}.
Wave 5{-10} has carried the price decisively into wave B{-8}’s target range. B waves in a Zigzag will typically retrace 38% to 79% of the preceding A wave. That gives wave B{-8} a likely endpoint between 4786 and 4730. I’ve marked those range boundaries on the chart in red, and the current price of wave B{-8} is within those boundaries.
So what happens next?
Wave B{-8}, when complete, will be followed by a rising final subwave — wave C{-8} — of the upward correction. Most likely the end of the C wave will also be the end of the parent wave 2{-7}. I say likely because corrective waves sometimes form a compound pattern, containing two or three corrective patterns. Such compound corrections are more in 4th waves, but they aren’t unheard of for 2nd waves. It’s not a high probability outcome, but it could happen.
Wave 2{-7} will be followed by a powerful downtrend, wave 3{-7}, that will carry the price at a minimum to wave 2{-7}’s starting point, 4702. Most likely, wave 3{-7} will move significantly below that level.
Eventually — after a corrective wave 4{-7} and a downtrending wave 5{-7} — the parent wave 1{-6} will reach its end, to be followed by four more waves at degree {-6} that will end the parent wave 1{-5}. And so it goes, the subwaves of each degree ending in turn until wave 3{-2} reaches its end, to be followed by an upward correction, wave 4{-2}.
And so it goes.
What are the alternatives? There are two.
Alternative #1: The 2nd wave rise (wave 2{-2} on the chart) that preceded the 3rd wave (wave 3{-2}) is still underway and is taking a compound form. The present decline is an X wave, which will link the first corrective pattern within wave 2 to a second corrective pattern. A compound correction contains up to three corrective patterns.
Alternative #2: This is more of a general observation. Assigning a degree to subwaves early in a correction is, frankly, little more than an educated guess. The degrees I’ve assigned may change over time as the downtrend progresses. So for example, wave 2{-7} on the chart could well be wave 2{-6} or 2{-5}.
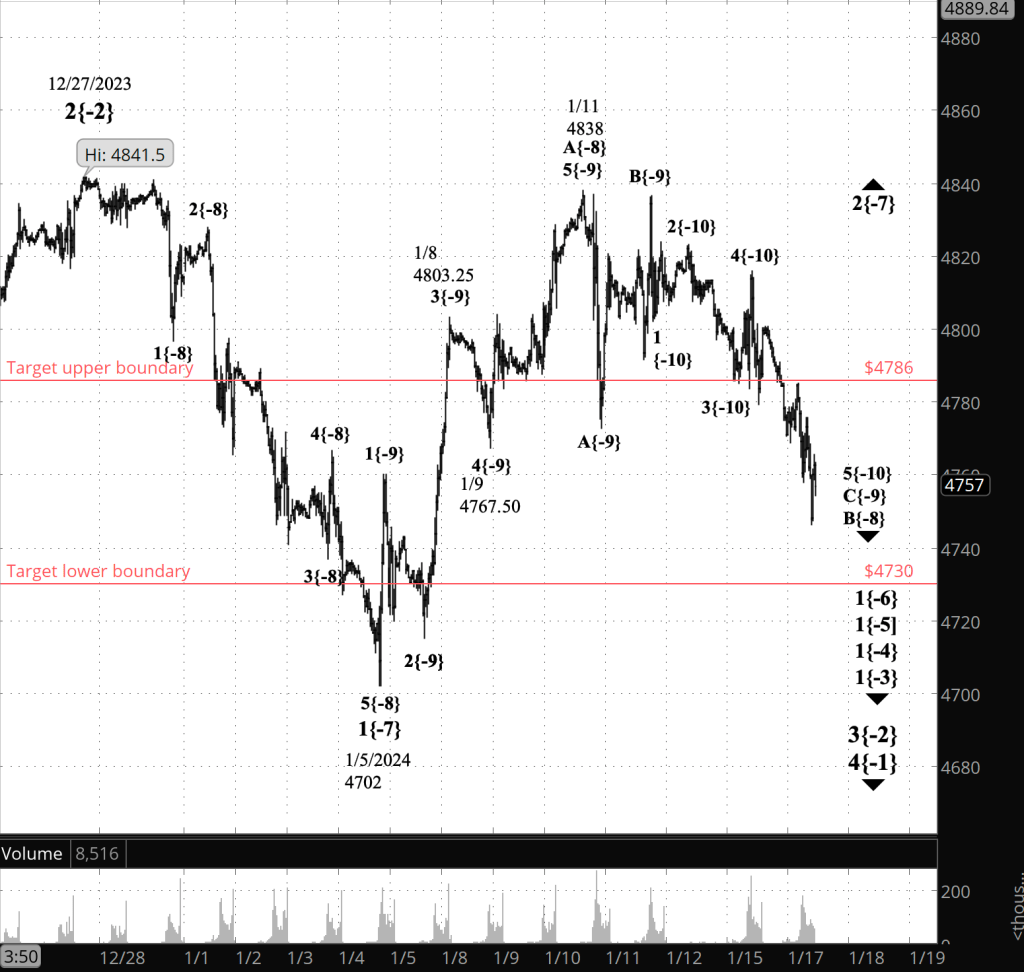
[S&P 500 E-mini futures at 3:30 p.m., 35-minute bars, with volume]
What does Elliott wave theory say? Here are the waves that underly the analyses.
Principal Analysis:
- Wave 5{0}, an expanding Diagonal Triangle, began on December 26, 2018.
- Within it, a downtrend, wave 4{-1}, began on January 4, 2022 and is underway.
- Wave 4{-1} is the parent wave of a downtrend, wave 3{-2}, that began on January 2, 2024 and is in wave 1{-3}, the first of five subwaves.
- Deep within that downtrend’s 1st wave, downtrending wave 5{-8} and its parent, wave 1{-7}, ended at the overnight low, 4702. Wave 2{-7} is now underway, an upward correction of low degree, and within it, declining wave B{-8} is underway and is within wave C{-9}, the last of three subwaves.
- Wave C{-9} is in its last of five subwaves, wave 5{-10}.
Alternative #1:
- Wave 2{-2}, an upward correction that began on October 13, 2022, continues and is taking a compound form.
- Wave X{-3} is underway, connecting the now complete first corrective pattern and the not-yet-begun second corrective pattern.
Alternative #2:
The upward correction that began on January 5, labeled on the chart was wave 2{-7}, is actually wave 2{-6}, or perhaps wave 2{-5}, or maybe even larger.
We Are Here.
These are the waves currently in progress under my principal analysis. Each line on the list shows the wave number, with the subscript in curly brackets, the traditional degree name, the starting date, the starting price of the S&P 500 E-mini futures, and the direction of the wave.
- S&P 500 Index:
- 5{+3} Supercycle, 7/8/1932, 4.40 (up)
- 5{+2} Cycle, 12/9/1974, 60.96 (up)
- 5{+1} Primary, 3/6/2009, 666.79 (up)
- 5{0} Intermediate, 12/26/2018, 2346.58 (up)
- S&P 500 Futures and index:
- 4{-1} Minor, 1/4/2022, 4953.25 (down) (futures), 4818.62 (down) (index)
- S&P 500 Futures:
- 3{-2} Minute, 12/27/2023, 4841.50 (down)
- 1{-3} Minuette, 12/27/2023, 4841.50 (down)
- 1{-4} Subminuette, 12/27/2023, 4841.50 (down)
- 1{-5} Micro, 12/27/2023, 4841.50 (down)
- 1{-6} Submicro, 12/27/2023, 4841.50 (down)
- 2{-7} Minuscule, 1/5/2024, 4702 (up)
Reading the chart. Price movements — waves – – in Elliott wave analysis are labeled with numbers within trending waves and letters with corrective waves. The subscripts — numbers in curly brackets — designate the wave’s degree, which, in Elliott wave analysis, means the relative position of a wave within the larger and smaller structures that make up the chart. R.N. Elliott, who in the 1930s developed the form of analysis that bears his name, viewed the chart as a complex structure of smaller waves nested within larger waves, which in turn are nested within still larger waves. In mathematics it’s called a fractal structure, where at every scale the pattern is similar to the others.
Learning and other resources. Elliott wave analysis provides context, not prophecy. As the 20th century semanticist Alfred Korzybski put it in his book Science and Sanity (1933), “The map is not the territory … The only usefulness of a map depends on similarity of structure between the empirical world and the map.” And I would add, in the ever-changing markets, we can judge that similarity of structure only after the fact.
See the menu page Analytical Methods for a rundown on where to go for information on Elliott wave analysis.
By Tim Bovee, Portland, Oregon, January 17, 2024
Disclaimer
Tim Bovee, Private Trader tracks the analysis and trades of a private trader for his own accounts. Nothing in this blog constitutes a recommendation to buy or sell stocks, options or any other financial instrument. The only purpose of this blog is to provide education and entertainment.
No trader is ever 100 percent successful in his or her trades. Trading in the stock and option markets is risky and uncertain. Each trader must make trading decisions for his or her own account, and take responsibility for the consequences.
License
All content on Tim Bovee, Private Trader by Timothy K. Bovee is licensed under a Creative Commons Attribution-ShareAlike 4.0 International License.
Based on a work at www.timbovee.com.

You must be logged in to post a comment.