3:30 p.m. New York time
Half an hour before the closing bell.The S&P 500 futures rose during the session, pushing above 4800. as the C wave continues within the upward 2nd-wave correction that began on January 5. This morning’s analysis is unchanged. I’ve updated the chart.
2:35 p.m. New York time
Trades. I’ve entered short Iron Fly positions on JPM and NKE, each one day before expiration, and have posted analyses of the trades.
I attempted to structure short Iron Condor and a short Vertical bull put spread on JNJ, which poublishes earnings on January 23, but was unable to produce sufficient return to make the trade worthwhile. So I passed on it.
9:35 a.m. New York time
What’s happening now? The S&P 500 E-mini futures rose back into the 4790s overnight, reversing from the prior day’s session low, 4746.
What does it mean? The upward correction that began from January 5 continues and is in its final subwave, wave C., by what I consider the be the most likely interpretation of the chart. The decline that began on January 11, wave B, carried the price into that subwave’s target price range, and the present rise has risen to above the price range’s upper boundary.
However, as is often the case in Elliott Wave analysis, the are multiple ways of viewing the chart. See a discussion of alternatives below.
Meanwhile, the wave C scenario is my principal analysis, and the question is how high can we expect it to rise.
The wave 2 correction is taking the from of a Zigzag. In that corrective pattern, wave C often is about the same length as the preceding wave A. The A wave was 136 points long, running from 4702 to 4838. Wave C began from 4846.25. If it rises by 136 points, then that sets the price target at 4846.25.
But there’s a problem. It’s a firm rule of Elliott Wave Theory that a 2nd wave never moves beyond the starting point of the preceding 1st wave. Downtrending wave 1 on the chart began on December 27, 2023 from 4841.50, about five points below the wave C price target. So the highest wave C can rise is by by 95.25, to 4841.50.
C waves on occasion fall short of their price targets. That will be the case with this wave C.
On the chart, I’ve marked the wave C price target with a solid red line, and retained the wave B price target range as blue dotted lines.
The C wave in a Zigzag has five subwaves. I’ve leveled the present rise as the first subwave within wave C.
What are the alternatives?
Alternative #1: The 2nd wave rise (wave 2{-2} on the chart) that preceded the 3rd wave (wave 3{-2}) is still underway and is taking a compound form. The decline from January 11 was an X wave, which will link the first corrective pattern within wave 2 to a second corrective pattern. A compound correction contains up to three corrective patterns.
Alternative #2: This is more of a general observation. Assigning a degree to subwaves early in a correction is, frankly, little more than an educated guess. The degrees I’ve assigned may change over time as the downtrend progresses. So for example, wave 2{-7} on the chart could well be wave 2{-6} or 2{-5}.
Alternative #3: Wave B{-8} within wave 2 is not yet complete.
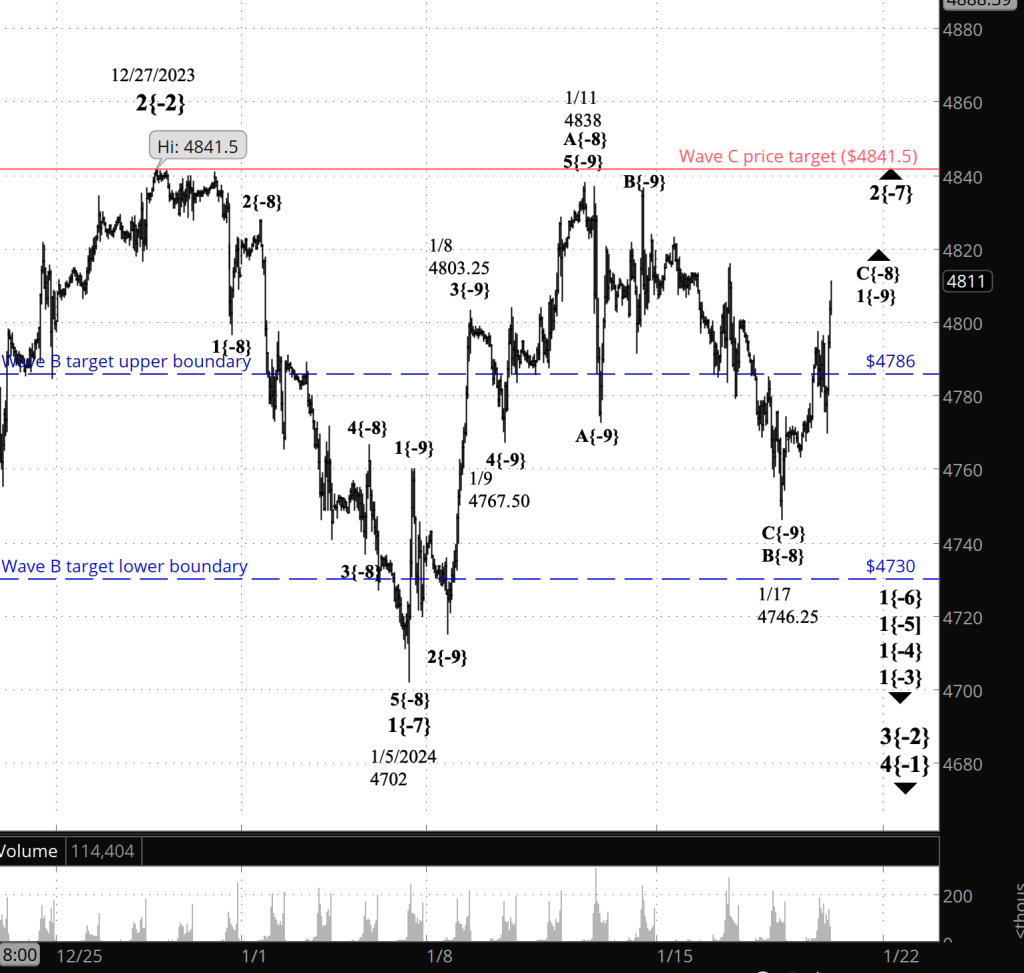
[S&P 500 E-mini futures at 3:30 p.m., 40-minute bars, with volume]
What does Elliott wave theory say? Here are the waves that underly the analyses.
Principal Analysis:
- Wave 5{0}, an expanding Diagonal Triangle, began on December 26, 2018.
- Within it, a downtrend, wave 4{-1}, began on January 4, 2022 and is underway.
- Wave 4{-1} is the parent wave of a downtrend, wave 3{-2}, that began on January 2, 2024 and is in wave 1{-3}, the first of five subwaves.
- Deep within that downtrend’s 1st wave, downtrending wave 5{-8} and its parent, wave 1{-7}, ended at the overnight low, 4702. Wave 2{-7} is now underway, an upward correction of low degree, and within it, rising wave C{-8} is underway and is within wave 1{-9}, the first of five subwaves.
Alternative #1:
- Wave 2{-2}, an upward correction that began on October 13, 2022, continues and is taking a compound form.
- Wave X{-3} is underway, connecting the now complete first corrective pattern and the not-yet-begun second corrective pattern.
Alternative #2:
The upward correction that began on January 5, labeled on the chart was wave 2{-7}, is actually wave 2{-6}, or perhaps wave 2{-5}, or maybe even larger.
Alternative #3:
- Downward wave B{-8} is underway.
We Are Here.
These are the waves currently in progress under my principal analysis. Each line on the list shows the wave number, with the subscript in curly brackets, the traditional degree name, the starting date, the starting price of the S&P 500 E-mini futures, and the direction of the wave.
- S&P 500 Index:
- 5{+3} Supercycle, 7/8/1932, 4.40 (up)
- 5{+2} Cycle, 12/9/1974, 60.96 (up)
- 5{+1} Primary, 3/6/2009, 666.79 (up)
- 5{0} Intermediate, 12/26/2018, 2346.58 (up)
- S&P 500 Futures and index:
- 4{-1} Minor, 1/4/2022, 4953.25 (down) (futures), 4818.62 (down) (index)
- S&P 500 Futures:
- 3{-2} Minute, 12/27/2023, 4841.50 (down)
- 1{-3} Minuette, 12/27/2023, 4841.50 (down)
- {1-4} Subminuette, 12/27/2023, 4841.50 (down)
- 1{-5} Micro, 12/27/2023, 4841.50 (down)
- 1{-6} Submicro, 12/27/2023, 4841.50 (down)
- 2{-7} Minuscule, 1/5/2024, 4702 (up)
Reading the chart. Price movements — waves – – in Elliott wave analysis are labeled with numbers within trending waves and letters with corrective waves. The subscripts — numbers in curly brackets — designate the wave’s degree, which, in Elliott wave analysis, means the relative position of a wave within the larger and smaller structures that make up the chart. R.N. Elliott, who in the 1930s developed the form of analysis that bears his name, viewed the chart as a complex structure of smaller waves nested within larger waves, which in turn are nested within still larger waves. In mathematics it’s called a fractal structure, where at every scale the pattern is similar to the others.
Learning and other resources. Elliott wave analysis provides context, not prophecy. As the 20th century semanticist Alfred Korzybski put it in his book Science and Sanity (1933), “The map is not the territory … The only usefulness of a map depends on similarity of structure between the empirical world and the map.” And I would add, in the ever-changing markets, we can judge that similarity of structure only after the fact.
See the menu page Analytical Methods for a rundown on where to go for information on Elliott wave analysis.
By Tim Bovee, Portland, Oregon, January 18, 2024
Disclaimer
Tim Bovee, Private Trader tracks the analysis and trades of a private trader for his own accounts. Nothing in this blog constitutes a recommendation to buy or sell stocks, options or any other financial instrument. The only purpose of this blog is to provide education and entertainment.
No trader is ever 100 percent successful in his or her trades. Trading in the stock and option markets is risky and uncertain. Each trader must make trading decisions for his or her own account, and take responsibility for the consequences.
License
All content on Tim Bovee, Private Trader by Timothy K. Bovee is licensed under a Creative Commons Attribution-ShareAlike 4.0 International License.
Based on a work at www.timbovee.com.

You must be logged in to post a comment.