3:45 p.m. New York time
Half an hour before the closing bell. The S&P 500 futures climbed during the session, reaching into the 4840s. In so doing, it broke a firm rule of Elliott Wave Theory: A 2nd wave correction cannot move beyond the starting point of the preceding 1st wave. And yet it did. The 1st wave ended at 4841.50. The 2nd wave so far today has reached a high in the 4870s.
The S&P 500 index also reached a new high. So did the S&P 500 exchange-traded fund SPY.
I’ve marked the chart according to the alternative analysis laid out this morning, showing that wave 2 is still underway. And yet, it can’t be. Something else is going on.
Elliott Wave Analysis provides a map of the price movements across the terrain, which is the chart. When the map no longer matches terrain, then it’s time to change the map. And that will be my project this weekend.
The simplest change will be to change the analysis to show wave 3{-1} never ended, that the massive rise from the February 23, 2020 end of the Covid Crash, 2191.86 on the S&P 500 index, to the January 4, 2022 peak at 4818.62 is still underway.
I’ll also look for other alternatives, but at first glance the continuing wave 3{-1} scenario seems the most likely.
See the January 12 Trader’s Notebook showing a long-term chart of the S&P 500 index, as analyzed before today’s violation of an Elliott Wave Theory rule.
I’ve retained this morning’s outdated chart, for comparison, and have posted a chart with the new analysis.
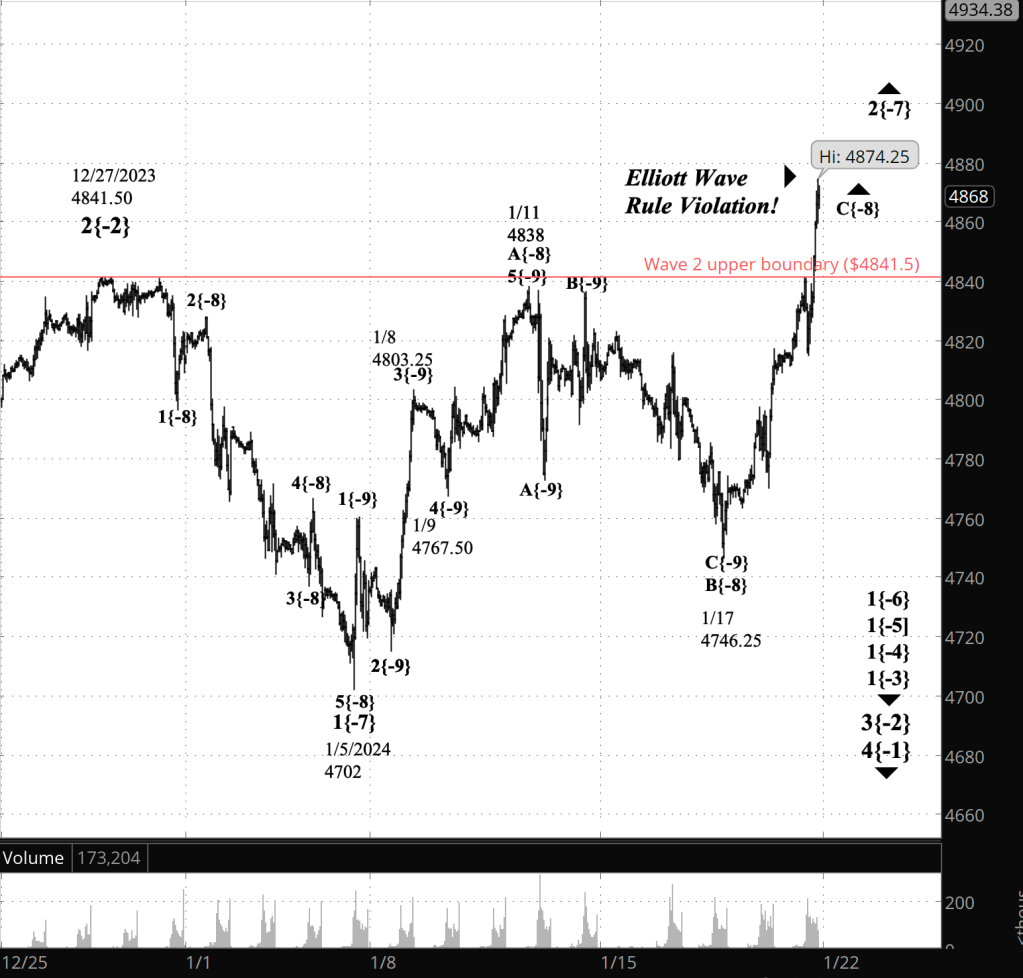
[S&P 500 E-mini futures at 3:30 p.m., 40-minute bars, with volume]
2:35 p.m. New York time
Trade CORRECTION. I’ve updated the SPY trade analysis to correct the strike price of the short call option.
2:10 p.m. New York time
Trades. Two out, two in.
I exited my 1DTE short Iron Fly positions on JPM and NKE. I selected them for their low volatility after my usual trading vehicles for 1DTE trades — SPY and QQQ — saw a rapid increase in volatility. It turned out to be a poor decision, leading to a 42.7% loss on JPM with a far smaller, 3.4%, loss on NKE.
I had found constructing the positions to be difficult because the strike prices changed by a larger increment relative to the stock price, which made it impossible to place the short strikes close to the 50% delta.
Meanwhile, QQQ and SPY saw their volatility decline to a level that meets my trading rule, and so I entered short Iron Fly positions on both to hold over the wekend. The 3DTE positions expire on Monday, January 22.
I’ve updated the analyses for the JPM and NKE trades, and posted trade analyses for the QQQ and SPY positions.
9:35 a.m. New York time
What’s happening now? The S&P 500 E-mini futures reached 4841.25 in overnight trading, putting the price within 25 cents of the December 27, 2023 peak.
What does it mean? A relatively small upward correction, wave 2, has been underway since January 5 and is now nearing the end of its third and final subwave, wave C. Or, perhaps, it may have ended already. Here’s why.
The December 27 peak was the starting point of wave 1 in the same five-wave series that wave 2 is part of.
A firm rule of Elliott Wave Theory is that a 2nd wave cannot move above the starting point of the preceding 1st wave. So if the price goes 25% higher, the Elliott Wave referee pulls out the red penalty flag, as in what the Americans call soccer and the rest of the world calls football. The penalty, of course, is to declare the present analysis to longer be valid and to be required to do a new analysis where there was no violation.
Or has the penalty been triggered? R.N. Elliott developed the theory that bears his name in a much simpler time. All he had to work with was each day’s open-high-low-close of the Dow Jones Industrial Average market index.
Nowadays when we refer to a market index, we’re speaking of a wide range of products. Trader’s Notebook tracks the S&P 500 index futures. They’re derived from the S&P 500 index. So is the most traded, most liquid S&P 500 derivative, the SPY exchange-traded fund. And in the nature of things it isn’t unusual for one product to beak the rule and get the red-flag penalty while the other related product remain penalty free.
After all, the smallest price movement of the S&P 500 index is one cent, about 1/4700 of the price at present. The index moves in 25-cent increments, around 1/1200 of the price. And the SPY exchange-traded fund moves in one-cent increments but the price is lower, so each move is about 1/470 of the price.
And each product is traded separately, so there can certainly be small variations in the fluctuation of the bids, asks and fills among the products.
Which S&P 500 triggers the penalty? Elliott is no help. I seriously doubt that he imagined that his method would have to deal with such complexity.
In any case, as the opening bell approached the price pulled back slightly from its overnight peak, and on the chart I’ve marked the upward correction, wave 2{-7}, as having ended at that point, 4841.25. It’s possible that the price will fish for a top, reaching 4841.50 before the day is out. But it can go no higher without triggering a red-flag penalty.
Under this principal analysis, downtrending wave 3{-7} has begun and is in its first subwave, downtrending wave 1{-8}, the first of five subwaves.
Third waves also have a limit: They always move beyond the end of the preceding wave 1. In this case, wave 1{-7} ended on January 5, at 4702.
Under another rule of Elliott Wave Theory, the third wave is never the shortest trending subwave. So wave 3{-7} will be either the longest or the second longest among waves 1, 3 and 5. It is far more common than not for a 3rd-wave correction to move significantly below the end of the preceding 1st wave.
What are the alternatives? There are two:
Alternative #1: Wave 2{-7} has not yet ended and will reach 4841.50, reaching completion at that point.
Alternative #2: Assigning a degree to subwaves early in a correction is, frankly, little more than an educated guess. The degrees I’ve assigned may change over time as the downtrend progresses. So for example, wave 2{-7} on the chart could well be wave 2{-6} or 2{-5}.
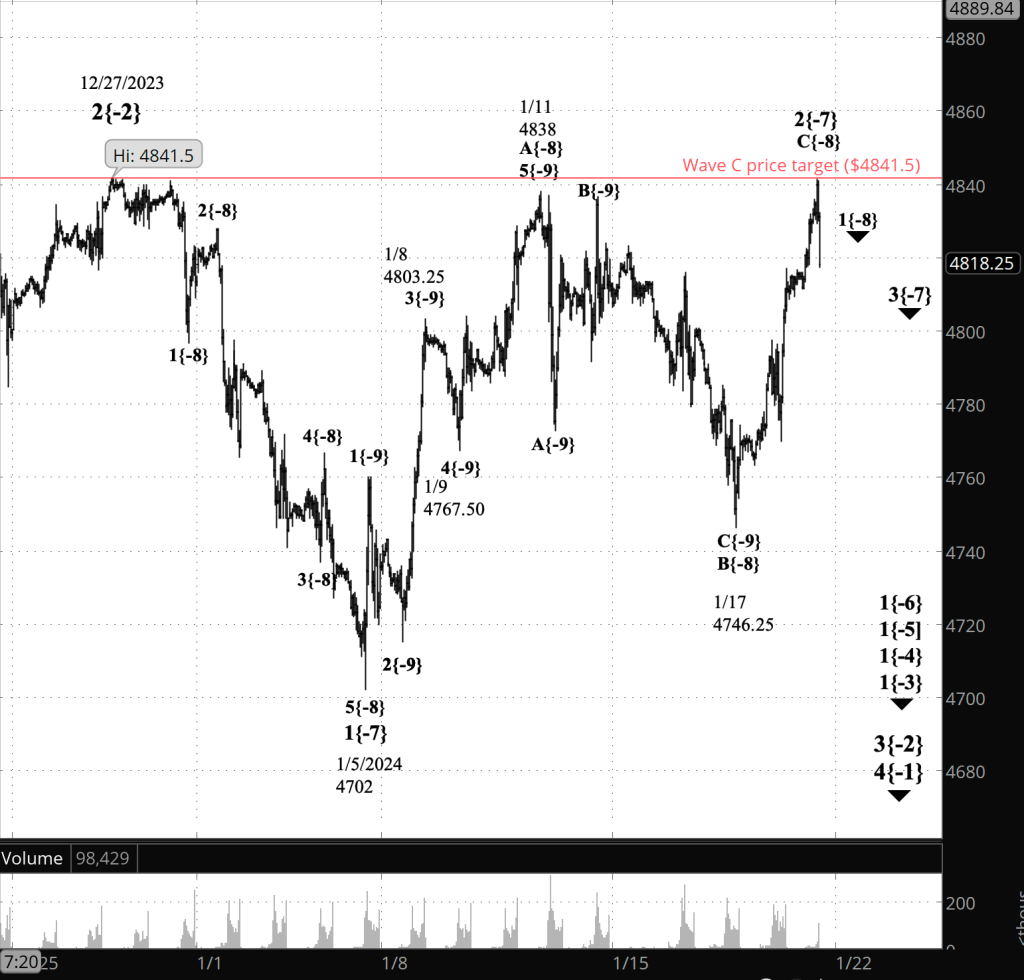
[OUTDATED: S&P 500 E-mini futures at 9:35 a.m., 40-minute bars, with volume]
What does Elliott wave theory say? Here are the waves that underly the analyses.
Principal Analysis (Proven incorrect):
- Wave 5{0}, an expanding Diagonal Triangle, began on December 26, 2018.
- Within it, a downtrend, wave 4{-1}, began on January 4, 2022 and is underway.
- Wave 4{-1} is the parent wave of a downtrend, wave 3{-2}, that began on January 2, 2024 and is in wave 1{-3}, the first of five subwaves.
- Deep within that downtrend’s 1st wave, downtrending wave 5{-8} and its parent, wave 2{-7}, ended at the overnight high, 4841.25. Wave 3{-7} is now underway, a downtrend of low degree, and within it, falling wave 1{-8} is underway.
Alternative #1:
- Wave 2{-7} is very close to completion but is not yet complete. It’s maximum possible end point is 4841.50.
- The above is correct: Wave 2{-7} hasn’t ended. But incorrect: It moved past 4841.50.
We Are Here.
These are the waves currently in progress under my principal analysis. Each line on the list shows the wave number, with the subscript in curly brackets, the traditional degree name, the starting date, the starting price of the S&P 500 E-mini futures, and the direction of the wave.
- S&P 500 Index:
- 5{+3} Supercycle, 7/8/1932, 4.40 (up)
- 5{+2} Cycle, 12/9/1974, 60.96 (up)
- 5{+1} Primary, 3/6/2009, 666.79 (up)
- 5{0} Intermediate, 12/26/2018, 2346.58 (up)
- S&P 500 Futures and index:
- [A violation of an Elliott Wave rule on 1/19/2024 calls what follows into question. I’ll post a new analysis on Monday, January 22.]
- 4{-1} Minor, 1/4/2022, 4953.25 (down) (futures), 4818.62 (down) (index)
- S&P 500 Futures:
- 3{-2} Minute, 12/27/2023, 4841.50 (down)
- 1{-3} Minuette, 12/27/2023, 4841.50 (down)
Reading the chart. Price movements — waves – – in Elliott wave analysis are labeled with numbers within trending waves and letters with corrective waves. The subscripts — numbers in curly brackets — designate the wave’s degree, which, in Elliott wave analysis, means the relative position of a wave within the larger and smaller structures that make up the chart. R.N. Elliott, who in the 1930s developed the form of analysis that bears his name, viewed the chart as a complex structure of smaller waves nested within larger waves, which in turn are nested within still larger waves. In mathematics it’s called a fractal structure, where at every scale the pattern is similar to the others.
Learning and other resources. Elliott wave analysis provides context, not prophecy. As the 20th century semanticist Alfred Korzybski put it in his book Science and Sanity (1933), “The map is not the territory … The only usefulness of a map depends on similarity of structure between the empirical world and the map.” And I would add, in the ever-changing markets, we can judge that similarity of structure only after the fact.
See the menu page Analytical Methods for a rundown on where to go for information on Elliott wave analysis.
By Tim Bovee, Portland, Oregon, January 19, 2024
Disclaimer
Tim Bovee, Private Trader tracks the analysis and trades of a private trader for his own accounts. Nothing in this blog constitutes a recommendation to buy or sell stocks, options or any other financial instrument. The only purpose of this blog is to provide education and entertainment.
No trader is ever 100 percent successful in his or her trades. Trading in the stock and option markets is risky and uncertain. Each trader must make trading decisions for his or her own account, and take responsibility for the consequences.
License
All content on Tim Bovee, Private Trader by Timothy K. Bovee is licensed under a Creative Commons Attribution-ShareAlike 4.0 International License.
Based on a work at www.timbovee.com.

You must be logged in to post a comment.