3:30 p.m. New York time
Half an hour before the closing bell. The S&P 500 futures declined during the session, so far never reaching the prior day’s high, 4933.25, and remaining above the prior day’s low, 4889.
Meaning that that the ambiguity described this morning remains. Two possible interpretations of what’s happening within the 5th-wave uptrend that began on January 5:
- The 5th subwave scenario: The larger uptrend is in its final leg, wave 5, also uptrending.
- The 4th subwave scenario: The larger uptrend is in its next-to-the-last leg, wave 4, a downward correction.
I’ve updated the chart
9:35 a.m. New York time
What’s happening now? The S&P 500 E-mini futures rose sharply after new GDP numbers came in better than expected.
What does it mean? The final subwave, Elliott wave 5, continues, within a larger 5th-wave uptrend that began on January 5. The rise is either the resumption of the uptrend or a continuation of the 4th-wave downward correction that brought the price lower late in yesterday’s session.
I’ve marked the chart to show the 5th-wave scenario. The two scenarios — 5th-wave beginning or 4th-wave continuation, are equally likely at this point. A price rise above the January 24 high, 4933.25, would confirm the 5th-wave beginning scenario. A drop below 4889, the overnight low, would confirm the 4th-wave continuation.
In either case, a much larger 3rd-wave uptrend that began on October 27, 2023 continues and is working through its end game. It will be followed by a large 4th-wave downward correction..
What are the alternatives? As noted above, there is some ambiguity about what wave of small degree the overnight rise represents, a rising 5th wave or the rising middle subwave, wave B, within a 4th-wave downward correction.
Also, There is rarely clarity about the degrees in relation to a fixed level. For example, is wave 5{-3} on the chart really at degree {-3}, or should it be {-4}? There’s no way to know for sure.
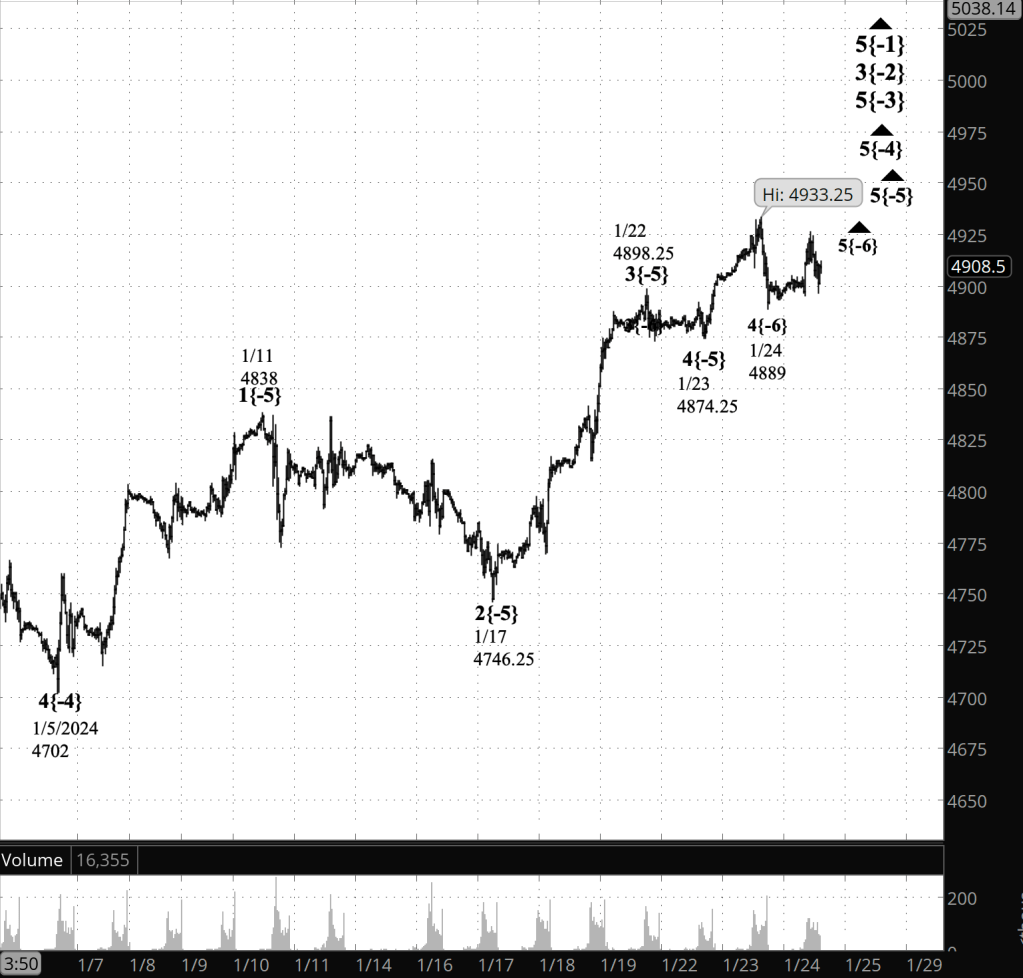
[S&P 500 E-mini futures at 3:30 p.m., 35-minute bars, with volume]
What does Elliott wave theory say? Here are the waves that underly the analyses.
Principal Analysis:
- Wave 5{0}, an expanding Diagonal Triangle, began on December 26, 2018.
- Within it, an uptrend, wave 5{-1}, began on October 13, 2022 and is underway.
- Wave 5{-1} is the parent wave of a uptrend, wave 3{-2}, that began on October 25, 2023 and is in wave 5{-3}, the last of five subwaves.
- Wave 5{-3} is in turn in its last subwave, wave 5{-4}, which is also in its final subwave, wave 5{-5}.
- When wave 5{-5} is complete, it will also be the end of waves 5{-4}, 5{-3} and 3{-2}, and a downward correction, wave 4{-2}, will begin.
- At a very small degree — hours rather than days — wave 5{-6} has begun its rise.
Alternative Analysis #1:
- At a very small degree, wave 4{-6}, a downward correction, has entered its middle subwave, rising wave B{-7}.
Alternative Analysis #2:
- The subwaves of wave 3{-2} could be one degree lower. For example, wave 5{-3} could really be wave 5{-4}, with the other subwaves’ degrees lower by one.
We Are Here.
These are the waves currently in progress under my principal analysis. Each line on the list shows the wave number, with the subscript in curly brackets, the traditional degree name, the starting date, the starting price of the S&P 500 E-mini futures, and the direction of the wave.
- S&P 500 Index:
- 5{+3} Supercycle, 7/8/1932, 4.40 (up)
- 5{+2} Cycle, 12/9/1974, 60.96 (up)
- 5{+1} Primary, 3/6/2009, 666.79 (up)
- 5{0} Intermediate, 12/26/2018, 2346.58 (up)
- S&P 500 Futures and index:
- 5{-1} Minor, 10/13/2022, 3502 (up) (futures), 3491.58 (up) (index)
- S&P 500 Futures:
- 3{-2} Minute, 10/27/2023, 4143.50 (up)
- 5{-3} Minuette, 10/27/2023, 4143.50 (up)
Reading the chart. Price movements — waves – – in Elliott wave analysis are labeled with numbers within trending waves and letters with corrective waves. The subscripts — numbers in curly brackets — designate the wave’s degree, which, in Elliott wave analysis, means the relative position of a wave within the larger and smaller structures that make up the chart. R.N. Elliott, who in the 1930s developed the form of analysis that bears his name, viewed the chart as a complex structure of smaller waves nested within larger waves, which in turn are nested within still larger waves. In mathematics it’s called a fractal structure, where at every scale the pattern is similar to the others.
Learning and other resources. Elliott wave analysis provides context, not prophecy. As the 20th century semanticist Alfred Korzybski put it in his book Science and Sanity (1933), “The map is not the territory … The only usefulness of a map depends on similarity of structure between the empirical world and the map.” And I would add, in the ever-changing markets, we can judge that similarity of structure only after the fact.
See the menu page Analytical Methods for a rundown on where to go for information on Elliott wave analysis.
By Tim Bovee, Portland, Oregon, January 25, 2024
Disclaimer
Tim Bovee, Private Trader tracks the analysis and trades of a private trader for his own accounts. Nothing in this blog constitutes a recommendation to buy or sell stocks, options or any other financial instrument. The only purpose of this blog is to provide education and entertainment.
No trader is ever 100 percent successful in his or her trades. Trading in the stock and option markets is risky and uncertain. Each trader must make trading decisions for his or her own account, and take responsibility for the consequences.
License
All content on Tim Bovee, Private Trader by Timothy K. Bovee is licensed under a Creative Commons Attribution-ShareAlike 4.0 International License.
Based on a work at www.timbovee.com.

You must be logged in to post a comment.