3:30 p.m. New York time
Half an hour before the closing bell. The S&P 500 rose to a new high during the session, in the 4950s so far, thereby confirming the principal analysis. A low degree 5th-wave uptrend that began on January 24 nearing its end.
When complete, it will cascade up the fractal structure, ending a series of progressively larger uptrends until it reaches a 3rd wave four degrees higher, which will end, and a 4th-wave downward correction of significant size will begin.
I’ve updated the chart.
3 p.m. New York time
Trades. One exit, one entry, both on derivatives of the S&P 500, both short-term trades designed to take advantage of volatility decline that is seen just prior to expiration.
I exited a 3DTE position on SPY, which included the weekend, for a 23.5% profit, and have updated the trade analysis with full data on the results.
I entered a 1DTE position on XSP, with the intention of exiting the next day, which is expiration day, and have posted a trade analysis.
9:35 a.m. New York time
What’s happening now? The S&P 500 E-mini futures traded sideways over night, with an initial decline followed by a recovery that together carried the price nowhere.
What does it mean? The low-degree 5th-wave uptrend that began on January 24 continues and is working through its 5th and final subwave. When that small subwave is complete, it will travel up the fractal structure of the chart, also ending three levels of waves of increasing size, and will also the the 3rd wave four degrees higher.
On the chart that 3rd wave is labeled as wave 3{-2}. The {-2} is a subscript showing the degree relative to others in the structure. Wave 3{-2} began on October 27, 2023. The small 5th-wave uptrend that will trigger it all it is wave 5{-6}.
Wave 3{-2} will be followed by a 4th-wave downward correction — wave 4{-2} — that will last for months.
What does the week ahead look like? In Elliott Wave Theory, the social mood drives the patterns waves make. Events are a small part — sometimes a large part — of that social mood. And the week will be rich with major events: On Wednesday, the Federal Open Market Committee will make a decision on interest rates: Lower them or leave them the same, or even raise them again. Wednesday will also see release of preview, the ADP report, of Friday’s Employment Situation Report, the latter being a major component when judging the state of the economy.
What are the alternatives? And the events of the week, as they impact the social mood, may well, at last clarify the great ambiguity that has been with us during the present low-degree uptrend. The alternative interpretation, also of high likelihood, sees the price movement from January 24 as a 4th wave, the next-to-the last subwave within the larger uptrending 5th wave. It will take a decisive move to the upside to resolve the ambiguity.
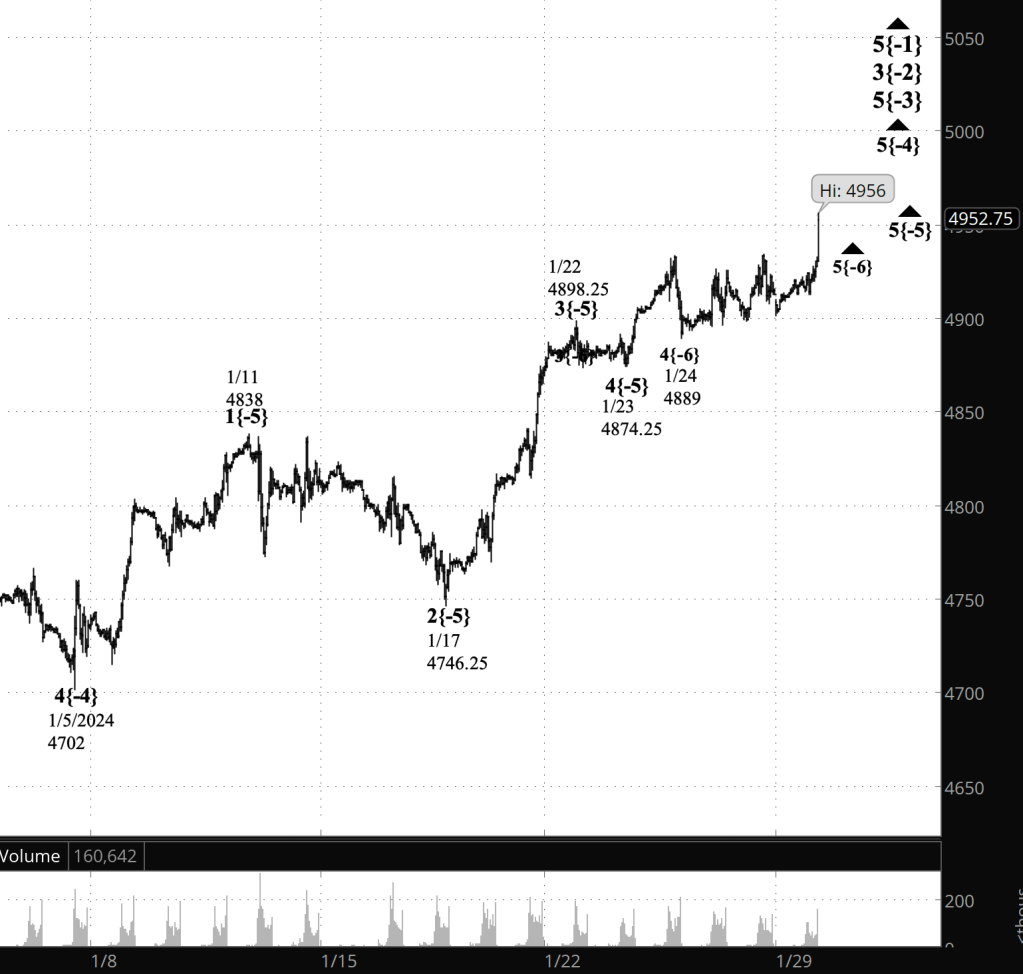
[S&P 500 E-mini futures at 3:30 p.m., 40-minute bars, with volume]
What does Elliott wave theory say? Here are the waves that underly the analyses.
Principal Analysis:
- Wave 5{0}, an expanding Diagonal Triangle, began on December 26, 2018.
- Within it, an uptrend, wave 5{-1}, began on October 13, 2022 and is underway.
- Wave 5{-1} is the parent wave of a uptrend, wave 3{-2}, that began on October 25, 2023 and is in wave 5{-3}, the last of five subwaves.
- Wave 5{-3} is in turn in its last subwave, wave 5{-4}, which is also in its final subwave, wave 5{-5}.
- When wave 5{-5} is complete, it will also be the end of waves 5{-4}, 5{-3} and 3{-2}, and a downward correction, wave 4{-2}, will begin.
- At a very small degree — hours rather than days — wave 5{-6} is underway.
Alternative Analysis:
- At a very small degree, wave 4{-6}, a downward correction, has entered its middle subwave, rising wave B{-7}.
We Are Here.
These are the waves currently in progress under my principal analysis. Each line on the list shows the wave number, with the subscript in curly brackets, the traditional degree name, the starting date, the starting price of the S&P 500 E-mini futures, and the direction of the wave.
- S&P 500 Index:
- 5{+3} Supercycle, 7/8/1932, 4.40 (up)
- 5{+2} Cycle, 12/9/1974, 60.96 (up)
- 5{+1} Primary, 3/6/2009, 666.79 (up)
- 5{0} Intermediate, 12/26/2018, 2346.58 (up)
- S&P 500 Futures and index:
- 5{-1} Minor, 10/13/2022, 3502 (up) (futures), 3491.58 (up) (index)
- S&P 500 Futures:
- 3{-2} Minute, 10/27/2023, 4143.50 (up)
- 5{-3} Minuette, 10/27/2023, 4143.50 (up)
Reading the chart. Price movements — waves – – in Elliott wave analysis are labeled with numbers within trending waves and letters with corrective waves. The subscripts — numbers in curly brackets — designate the wave’s degree, which, in Elliott wave analysis, means the relative position of a wave within the larger and smaller structures that make up the chart. R.N. Elliott, who in the 1930s developed the form of analysis that bears his name, viewed the chart as a complex structure of smaller waves nested within larger waves, which in turn are nested within still larger waves. In mathematics it’s called a fractal structure, where at every scale the pattern is similar to the others.
Learning and other resources. Elliott wave analysis provides context, not prophecy. As the 20th century semanticist Alfred Korzybski put it in his book Science and Sanity (1933), “The map is not the territory … The only usefulness of a map depends on similarity of structure between the empirical world and the map.” And I would add, in the ever-changing markets, we can judge that similarity of structure only after the fact.
See the menu page Analytical Methods for a rundown on where to go for information on Elliott wave analysis.
By Tim Bovee, Portland, Oregon, January 29, 2024
Disclaimer
Tim Bovee, Private Trader tracks the analysis and trades of a private trader for his own accounts. Nothing in this blog constitutes a recommendation to buy or sell stocks, options or any other financial instrument. The only purpose of this blog is to provide education and entertainment.
No trader is ever 100 percent successful in his or her trades. Trading in the stock and option markets is risky and uncertain. Each trader must make trading decisions for his or her own account, and take responsibility for the consequences.
License
All content on Tim Bovee, Private Trader by Timothy K. Bovee is licensed under a Creative Commons Attribution-ShareAlike 4.0 International License.
Based on a work at www.timbovee.com.

You must be logged in to post a comment.