3:30 p.m. New York time
Half an hour before the closing bell. The small 4th-wave downward correction discussed this morning moved below the end of the preceding 1st wave, violating a rule of Elliott Wave Theory,
The movement makes it clear that a truncated wave 5{-8} ended on January 30 at 4957.25, the same price as the end of the preceding wave 3{-8}. The end of wave 5{-8} also marks the end of its parent wave — wave 3{-7} — and the beginning of a larger 4th-wave downward correction.
I’ve updated the chart.
3:29 p.m. New York time
Trade. With the end of uptrending wave 5{-8}, My bull put Vertical Spread position was no longer viable, and I exited for a 64.6% loss. I’ve updated the trade analysis with results.
9:35 a.m. New York time
What’s happening now? The S&P 500 E-mini futures traded sideways overnight, whipsawing as the ADP Employment Report was published.
What does it mean? A small 4th-wave downward correction continues, part of a series of uptrends of increasing size. The 4th wave will be followed by a 5th and final wave that will cascade up the fractal structure, ending the uptrend that began on October 27, 2023 and beginning a 4th-wave downward correction of major proportions.
What are the alternatives? It’s possible that the wave degrees on the chart, showing where the wave fits within the fractal structure of the chart, are off by one degrees for the smaller waves. For example, perhaps wave 4{-8} should be labeled 4{-7}. The degree is shown as a subscript within curly brackets.
Looking forward. The Federal Open Market Committee will release a statement at 2 p.m. New York time stating its intentions for interest rates: Lower them, raise them or leave them unchanged. Federal Reserve Chair Jerome Powell will hold news conference half an hour later, at 2:30 p.m.
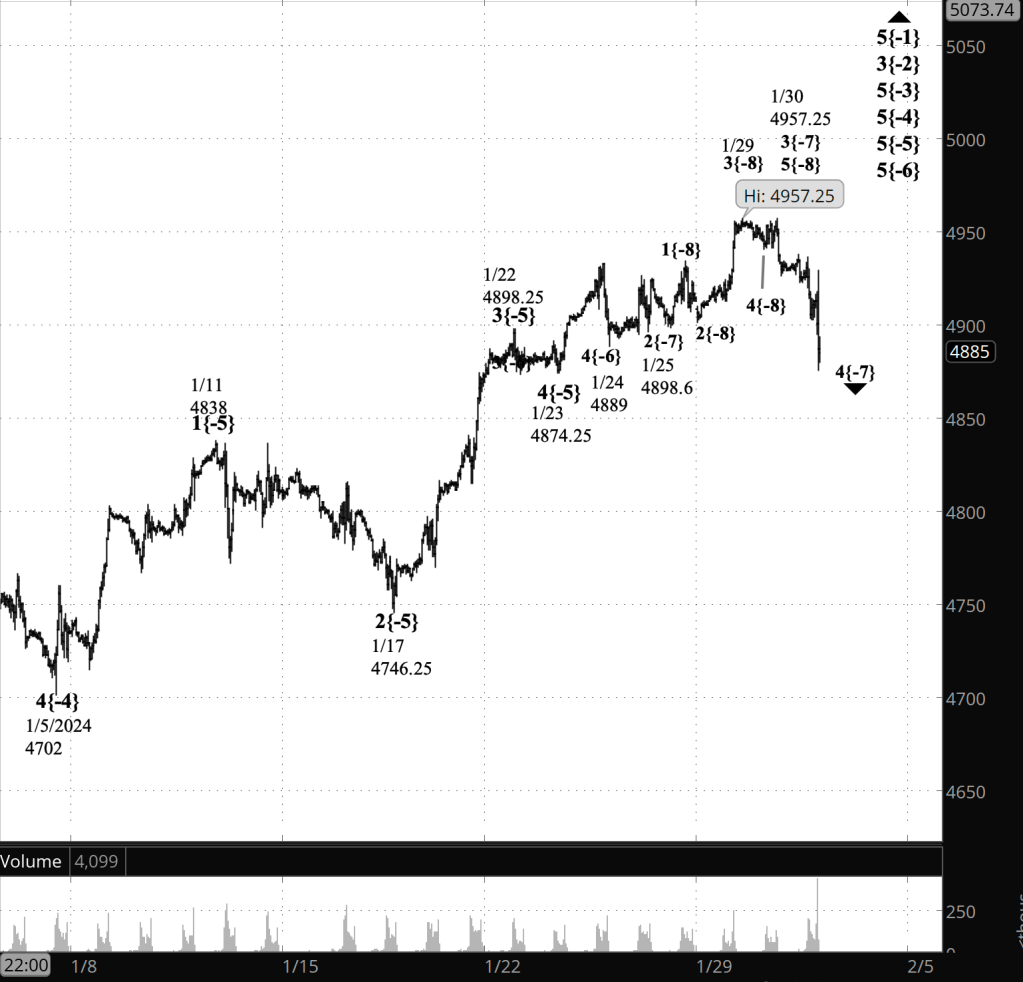
[S&P 500 E-mini futures at 3:30 p.m., 45-minute bars, with volume]
What does Elliott wave theory say? Here are the waves that underly the analyses.
Principal Analysis:
- Wave 5{0}, an expanding Diagonal Triangle, began on December 26, 2018.
- Within it, an uptrend, wave 5{-1}, began on October 13, 2022 and is underway.
- Wave 5{-1} is the parent wave of a uptrend, wave 3{-2}, that began on October 25, 2023 and is in wave 5{-3}, the last of five subwaves.
- Wave 5{-3} is in turn in its last subwave, wave 5{-4}, which is also in its final subwave, wave 5{-5}.
- When wave 5{-5} is complete, it will also be the end of waves 5{-4}, 5{-3} and 3{-2}, and a downward correction, wave 4{-2}, will begin.
- At a very small degree — hours rather than days — wave 5{-6} is underway.
- Within wave 5{-6}, wave 3{-7} is continuing its rise and has entered a downward correction, wave 4{-8}.
- AFTERNOON UPDATE: Wave 3{-7} ended on January 30 and wave 4{-7} began on that date.
Alternative Analysis:
- Within wave 5{-6}, a downward correction, wave 4{-7}, is underway.
We Are Here.
These are the waves currently in progress under my principal analysis. Each line on the list shows the wave number, with the subscript in curly brackets, the traditional degree name, the starting date, the starting price of the S&P 500 E-mini futures, and the direction of the wave.
- S&P 500 Index:
- 5{+3} Supercycle, 7/8/1932, 4.40 (up)
- 5{+2} Cycle, 12/9/1974, 60.96 (up)
- 5{+1} Primary, 3/6/2009, 666.79 (up)
- 5{0} Intermediate, 12/26/2018, 2346.58 (up)
- S&P 500 Futures and index:
- 5{-1} Minor, 10/13/2022, 3502 (up) (futures), 3491.58 (up) (index)
- S&P 500 Futures:
- 3{-2} Minute, 10/27/2023, 4143.50 (up)
- 5{-3} Minuette, 10/27/2023, 4143.50 (up)
Reading the chart. Price movements — waves – – in Elliott wave analysis are labeled with numbers within trending waves and letters with corrective waves. The subscripts — numbers in curly brackets — designate the wave’s degree, which, in Elliott wave analysis, means the relative position of a wave within the larger and smaller structures that make up the chart. R.N. Elliott, who in the 1930s developed the form of analysis that bears his name, viewed the chart as a complex structure of smaller waves nested within larger waves, which in turn are nested within still larger waves. In mathematics it’s called a fractal structure, where at every scale the pattern is similar to the others.
Learning and other resources. Elliott wave analysis provides context, not prophecy. As the 20th century semanticist Alfred Korzybski put it in his book Science and Sanity (1933), “The map is not the territory … The only usefulness of a map depends on similarity of structure between the empirical world and the map.” And I would add, in the ever-changing markets, we can judge that similarity of structure only after the fact.
See the menu page Analytical Methods for a rundown on where to go for information on Elliott wave analysis.
By Tim Bovee, Portland, Oregon, January 31, 2024
Disclaimer
Tim Bovee, Private Trader tracks the analysis and trades of a private trader for his own accounts. Nothing in this blog constitutes a recommendation to buy or sell stocks, options or any other financial instrument. The only purpose of this blog is to provide education and entertainment.
No trader is ever 100 percent successful in his or her trades. Trading in the stock and option markets is risky and uncertain. Each trader must make trading decisions for his or her own account, and take responsibility for the consequences.
License
All content on Tim Bovee, Private Trader by Timothy K. Bovee is licensed under a Creative Commons Attribution-ShareAlike 4.0 International License.
Based on a work at www.timbovee.com.

You must be logged in to post a comment.