3:30 p.m. New York time
Half an hour before the closing bell. The S&P 500 futures continued to decline during the session, reaching into the 4930s as the closing bell approached. The price remains slightly more than 100 points above the upper boundary of the target range for the 4th-wave downward correction, which began on February 12. That target range, described below in this morning’s analysis, reflects a tendency, not a firm rule. The correction could end above that target, or decline far below it.
Typically, 4th waves have three subwaves. The first of the three, the A wave, is now underway. It will be followed by a rising B wave, and then a final C wave that will complete the correction. That’s a roundabout way of saying that there is lots of time and room for further decline.
I’ve updated the upper chart.
9:35 a.m. New York time
What’s happening now? The S&P 500 E-mini futures continued to decline overnight, picking up the pace after January’s inflation rate came in higher than economists had forecast.
What does it mean? The decline is the first subwave, wave A, of a 4th-wave downward correction that began on February 12 from 5056.50. The overnight decline brought the price into the 4960s as the opening bell approached.
The 4th wave a subwave of a larger uptrend, a 3rd wave, that began on October 13, 2022, from 3502.
Returning to the 4th-wave correction that began on February 12: Like many 4th waves, this one may end within the prior 3rd wave’s 4th subwave, putting the endpoint between 4830.75, attained on December 20, 2023, and 4702, attained on January 5 at 4702.
What are the alternatives? Yesterday’s alternative suggested that the decline might quickly reverse to the upside, showing that the downward correction had not yet begun. Given the speed and magnitude of the decline, that quite cautious alternative is off the table, and I have no alternatives at present.
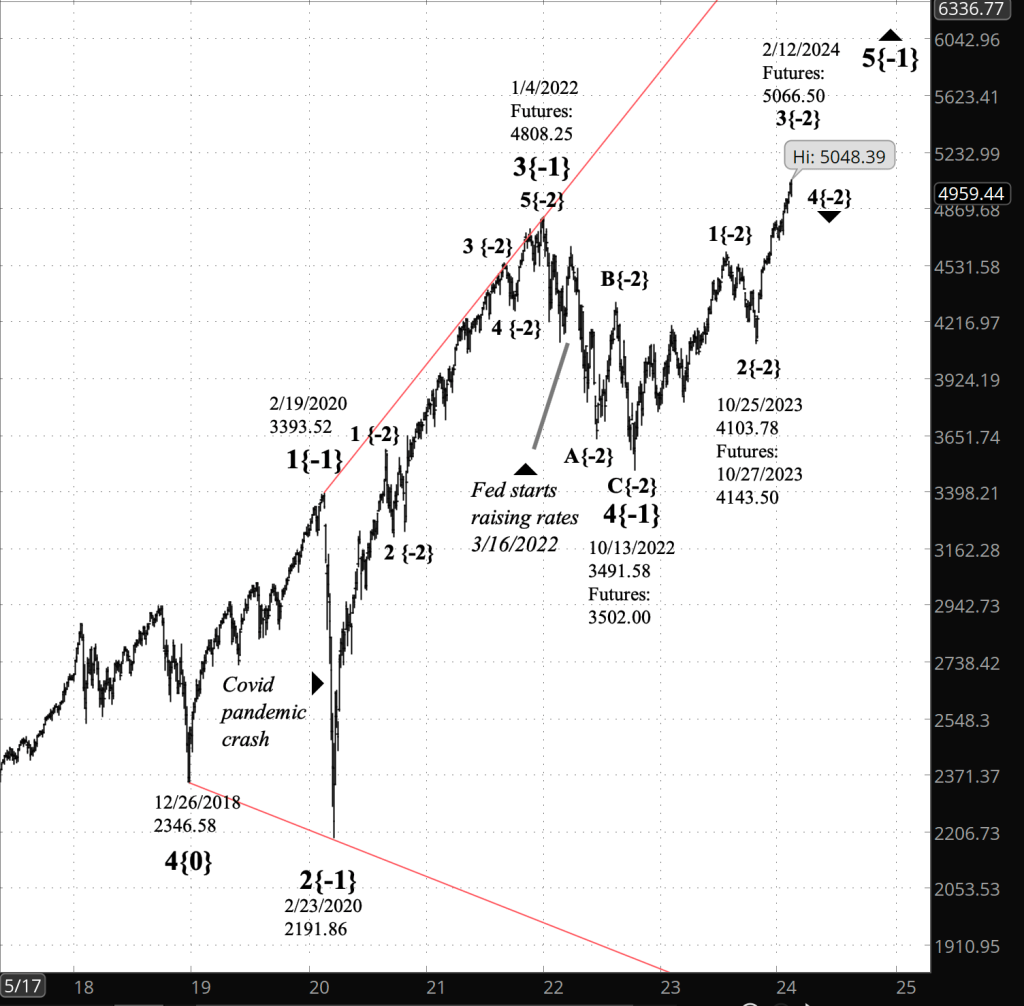
The charts. The upper chart shows the rise from January 31 to February 12 and the subsequent decline. The lower chart shows the entire 5th-wave uptrend, an expanding Diagonal Triange, that began on December 26, 2018 and which encompasses all of the ups and downs that have happened since, including the Covid Crash of 2020 and the Federal Reserves rapid rate increases of 2022.
The upper chart shows the upper boundary of the 4th-wave price target, in red. The lower chart shows the price channel of the large 5th wave’s expanding Diagonal Triangle.
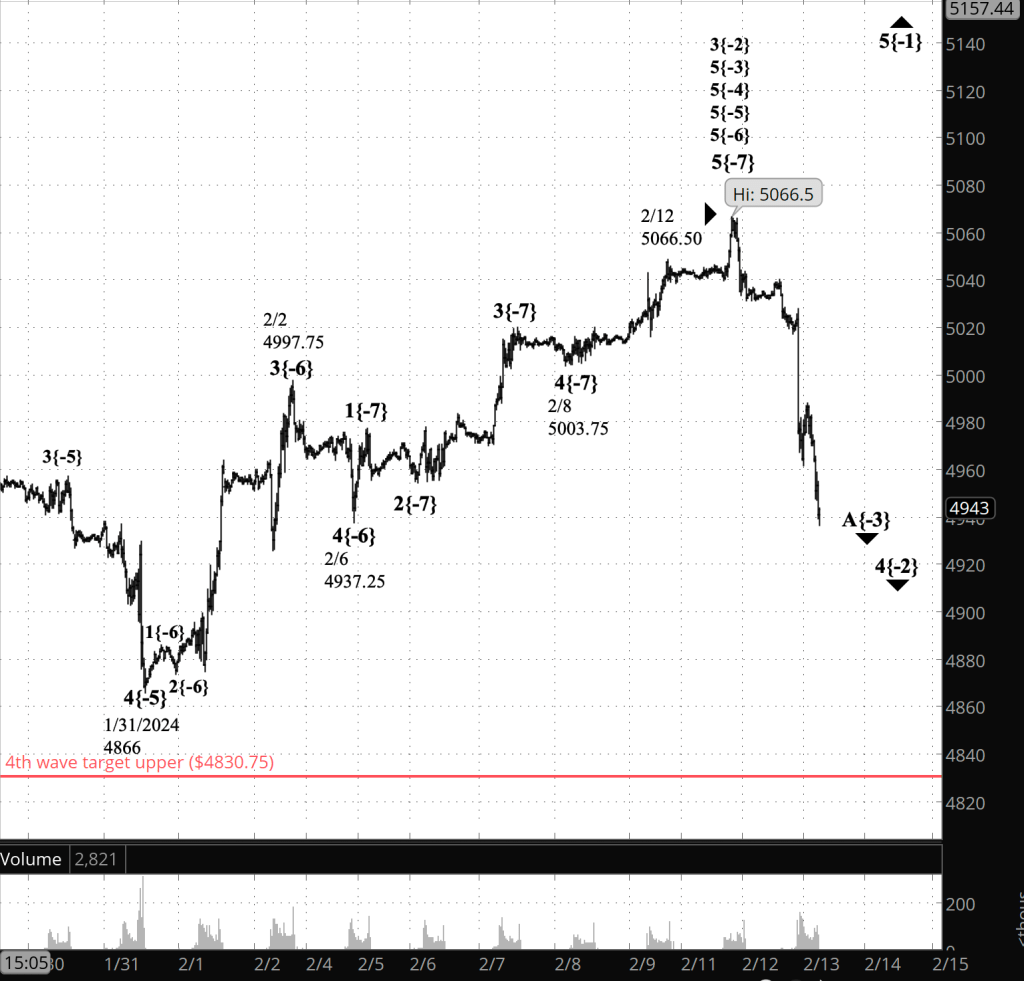
[S&P 500 E-mini futures at 9:35 a.m., 25-minute bars, with volume]
[S&P 500 index at 9:34 a.m., 3-day bars]
What does Elliott wave theory say? Here are the waves that underly the analyses.
Principal Analysis:
- Wave 5{0}, an expanding Diagonal Triangle, began on December 26, 2018.
- Within it, an uptrend, wave 5{-1}, began on October 13, 2022 and is underway.
- Wave 5{-1} is the parent wave of a downward correction, wave 4{-2}, that began on February 12, 2024.
- Wave 4{-2} is in its first subwave, wave A{-3}.
We Are Here.
These are the waves currently in progress under my principal analysis. Each line on the list shows the wave number, with the subscript in curly brackets, the traditional degree name, the starting date, the starting price of the S&P 500 E-mini futures, and the direction of the wave.
- S&P 500 Index:
- 5{+3} Supercycle, 7/8/1932, 4.40 (up)
- 5{+2} Cycle, 12/9/1974, 60.96 (up)
- 5{+1} Primary, 3/6/2009, 666.79 (up)
- 5{0} Intermediate, 12/26/2018, 2346.58 (up)
- S&P 500 Futures and index:
- 5{-1} Minor, 10/13/2022, 3502 (up) (futures), 3491.58 (up) (index)
- S&P 500 Futures:
- 4{-2} Minute, 2/12/2024, 5066.50 (down)
- A{-3} Minuette, 2/12/2024, 5066.60 (down)
Reading the chart. Price movements — waves – – in Elliott wave analysis are labeled with numbers within trending waves and letters with corrective waves. The subscripts — numbers in curly brackets — designate the wave’s degree, which, in Elliott wave analysis, means the relative position of a wave within the larger and smaller structures that make up the chart. R.N. Elliott, who in the 1930s developed the form of analysis that bears his name, viewed the chart as a complex structure of smaller waves nested within larger waves, which in turn are nested within still larger waves. In mathematics it’s called a fractal structure, where at every scale the pattern is similar to the others.
Learning and other resources. Elliott wave analysis provides context, not prophecy. As the 20th century semanticist Alfred Korzybski put it in his book Science and Sanity (1933), “The map is not the territory … The only usefulness of a map depends on similarity of structure between the empirical world and the map.” And I would add, in the ever-changing markets, we can judge that similarity of structure only after the fact.
See the menu page Analytical Methods for a rundown on where to go for information on Elliott wave analysis.
By Tim Bovee, Portland, Oregon, February 13, 2024
Disclaimer
Tim Bovee, Private Trader tracks the analysis and trades of a private trader for his own accounts. Nothing in this blog constitutes a recommendation to buy or sell stocks, options or any other financial instrument. The only purpose of this blog is to provide education and entertainment.
No trader is ever 100 percent successful in his or her trades. Trading in the stock and option markets is risky and uncertain. Each trader must make trading decisions for his or her own account, and take responsibility for the consequences.
License
All content on Tim Bovee, Private Trader by Timothy K. Bovee is licensed under a Creative Commons Attribution-ShareAlike 4.0 International License.
Based on a work at www.timbovee.com.

You must be logged in to post a comment.