3:55 p.m. New York time
Trade. I exited my 4DTE short Iron Fly position on SPY for a 22.8% loss. Trading after the 3-day holiday weekend sent the price sliding beyond its projected low. I’ve updated the trade analysis with full results.
Given the higher volatility of the market, and the tendency to make dramatic moves, I’ve concluded that the low DTE strategy isn’t productive at present, and I’ll be passing on it until things change. By low DTE I mean 1DTE, 3DTE before a weekend, or, as in this case, 4DTE for a 3-day holiday weekend.
Instead, I’ll focus on the 45DTE strategy, managed at 21 days before expiration.
3:30 p.m. New York time
Half an hour before the closing bell. The S&P 500 futures continued to drop sharply during the session, reaching into the 4960s. The 3rd and final subwave, wave C, within a larger corrective subwave, wave A, within a downward correction that began on February 12, wave 4, continues and is in its endgame.
When complete, the larger A wave — wave A{-3} on the chart — also ends, and rising wave B{-3} begins, the middle wave of the still larger 4th wave downward correction, wave 4{-2} on the chart. Wave B{-3} will have three subwaves.
9:35 a.m. New York time
What’s happening now? The S&P 500 E-mini futures continued to decline when trading resumed. The price so far has reached into the 4990s.
What does it mean? There are three levels, or “degrees” in the terminology of Elliott Wave Theory, of waves in play on the chart. At lowest degree, a third and final subwave, wave C, is underway. It is part of a declining A wave, the first subwave of a downward correction one degree larger, wave 4, which began on February 12 from 5056.50.
Despite the drama of the chart, the price has yet to reach 100 points below the start of wave 4. And the present C wave which is the smallest degree in play is part of only the 1st subwave of that correction. The chart suggests more downside ahead, composed of the usual ups and downs.
What are the alternatives? None at present. I’m quite certain that ambiguities will develop.
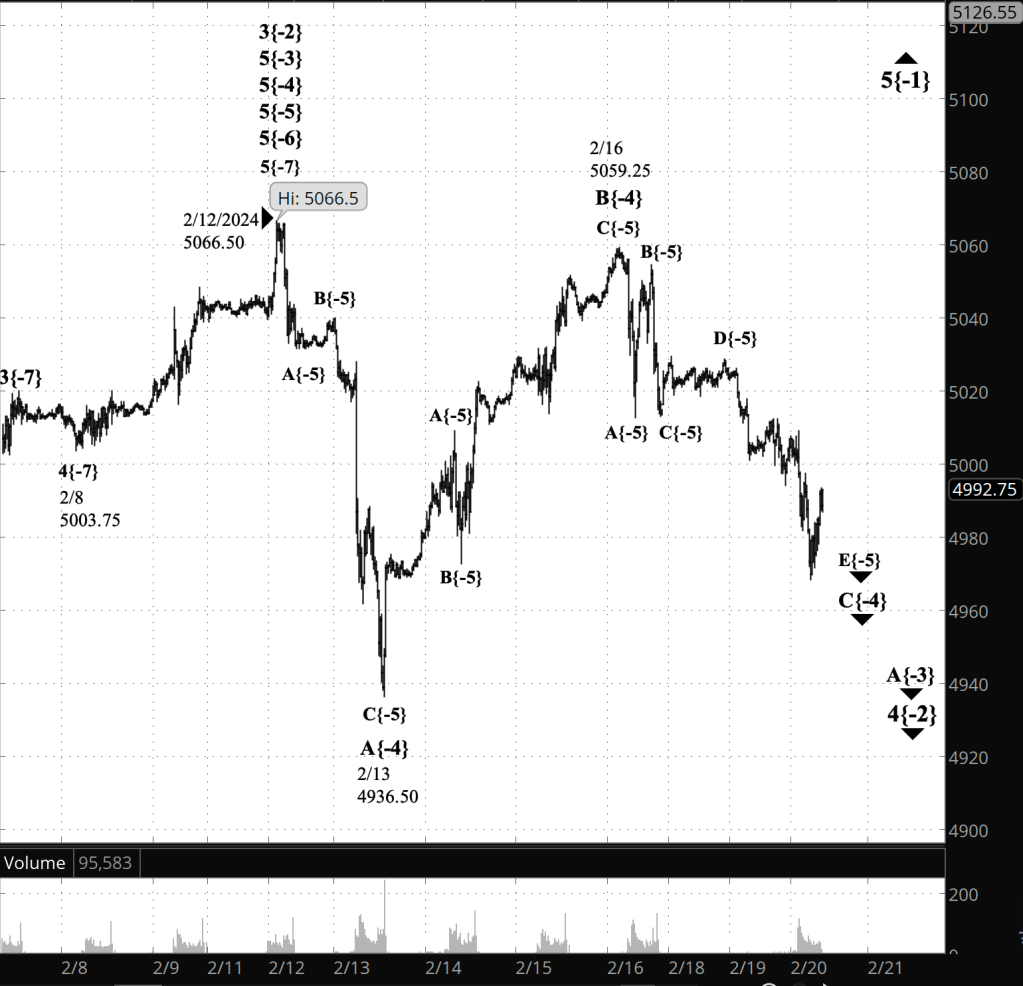
[S&P 500 E-mini futures at 3:30 p.m., 20-minute bars, with volume]
What does Elliott wave theory say? Here are the waves that underly the analyses.
Principal Analysis:
- Wave 5{0}, an expanding Diagonal Triangle, began on December 26, 2018.
- Within it, an uptrend, wave 5{-1}, began on October 13, 2022 and is underway.
- Wave 5{-1} is the parent wave of a downward correction, wave 4{-2}, that began on February 12, 2024.
- Wave 4{-2} is in its first subwave, wave A{-3}, which in turn is in wave C{-4}, its third and final subwave.
- Within Wave C{-4}, the middle wave of five subwaves, declining wave E{-5}, is underway.
We Are Here.
These are the waves currently in progress under my principal analysis. Each line on the list shows the wave number, with the subscript in curly brackets, the traditional degree name, the starting date, the starting price of the S&P 500 E-mini futures, and the direction of the wave.
- S&P 500 Index:
- 5{+3} Supercycle, 7/8/1932, 4.40 (up)
- 5{+2} Cycle, 12/9/1974, 60.96 (up)
- 5{+1} Primary, 3/6/2009, 666.79 (up)
- 5{0} Intermediate, 12/26/2018, 2346.58 (up)
- S&P 500 Futures and index:
- 5{-1} Minor, 10/13/2022, 3502 (up) (futures), 3491.58 (up) (index)
- S&P 500 Futures:
- 4{-2} Minute, 2/12/2024, 5066.50 (down)
- A{-3} Minuette, 2/12/2024, 5066.60 (down)
Reading the chart. Price movements — waves – – in Elliott wave analysis are labeled with numbers within trending waves and letters with corrective waves. The subscripts — numbers in curly brackets — designate the wave’s degree, which, in Elliott wave analysis, means the relative position of a wave within the larger and smaller structures that make up the chart. R.N. Elliott, who in the 1930s developed the form of analysis that bears his name, viewed the chart as a complex structure of smaller waves nested within larger waves, which in turn are nested within still larger waves. In mathematics it’s called a fractal structure, where at every scale the pattern is similar to the others.
Learning and other resources. Elliott wave analysis provides context, not prophecy. As the 20th century semanticist Alfred Korzybski put it in his book Science and Sanity (1933), “The map is not the territory … The only usefulness of a map depends on similarity of structure between the empirical world and the map.” And I would add, in the ever-changing markets, we can judge that similarity of structure only after the fact.
See the menu page Analytical Methods for a rundown on where to go for information on Elliott wave analysis.
By Tim Bovee, Portland, Oregon, February 20, 2024
Disclaimer
Tim Bovee, Private Trader tracks the analysis and trades of a private trader for his own accounts. Nothing in this blog constitutes a recommendation to buy or sell stocks, options or any other financial instrument. The only purpose of this blog is to provide education and entertainment.
No trader is ever 100 percent successful in his or her trades. Trading in the stock and option markets is risky and uncertain. Each trader must make trading decisions for his or her own account, and take responsibility for the consequences.
License
All content on Tim Bovee, Private Trader by Timothy K. Bovee is licensed under a Creative Commons Attribution-ShareAlike 4.0 International License.
Based on a work at www.timbovee.com.

You must be logged in to post a comment.