3:30 p.m. New York time
Half an hour before the closing bell. The S&P 500 futures rose during the session, coming to within 2 points of the upper boundary of the price target for the middle subwave of the upward correction that began in mid-February. It then pulled back from the 5123.50 peak.
I’ve updated the chart to designate that peak as the end of rising wave A{-5} and the beginning of declining wave B{-5}. At that small {-5} degree, we’re tracking wave that last a day, may two days.
Wave A{-5} had five subwaves — maybe. This morning I discussed the difficulty of counting the subwaves of such a fast and powerful price movement, and it still holds true, except for the 4th subwave. Five subwaves in the A wave means that the form is that of a Zigzag. B waves in a Zigzag never move beyond the starting point of the previous A wave (4959 in this case), and tend to retrace between 38% and 79% of wave A.
9:35 a.m. New York time
What’s happening now? The S&P 500 E-mini futures largely traded sideways within a narrow range, breaking higher into the 5120s as the opening bell sounded.
What does it mean? In terms of Elliott Wave Theory, the S&P 500 futures chart is in the 1st subwave within a larger 1st subwave within a still larger 2nd subwave that in turn is part of a 4th-wave upward correction that began on February 12.
On the chart, with wave numbers followed by subscripts in curly brackets showing the relative degree, that translates into rising wave A{-5} within rising wave A{-4} within rising wave B{-3} within declining wave 4{-2}. (See the “Reading the chart” section, below, for more on degrees.)
On the chart I made a tentative attempt to understand the internal structure, at the {-6} degree. One problem is that the energy of the rise was so great that the corrective subwaves are hard to discern, and even harder to place within the fractal nature of the chart. They seem way too small to be the same degree as the waves carrying the price higher.
By that count, wave A{-5} is in its final subwave. It will be followed by declining wave B{-5}, the middle subwave of rising wave A{-4}.
The dashed red line at the top of the chart shows the upper boundary of the wave B{-3} target price range, at 5125. The target range is a tendency, not a rule, within Elliott Wave Theory.
What are the alternatives? I see some uncertainty in this rise in several of the lower degrees. Are the degree designators correct? No way to tell at this point, although the progress of wave B{-3}, whose placement I have confidence in, will better define its subwaves.
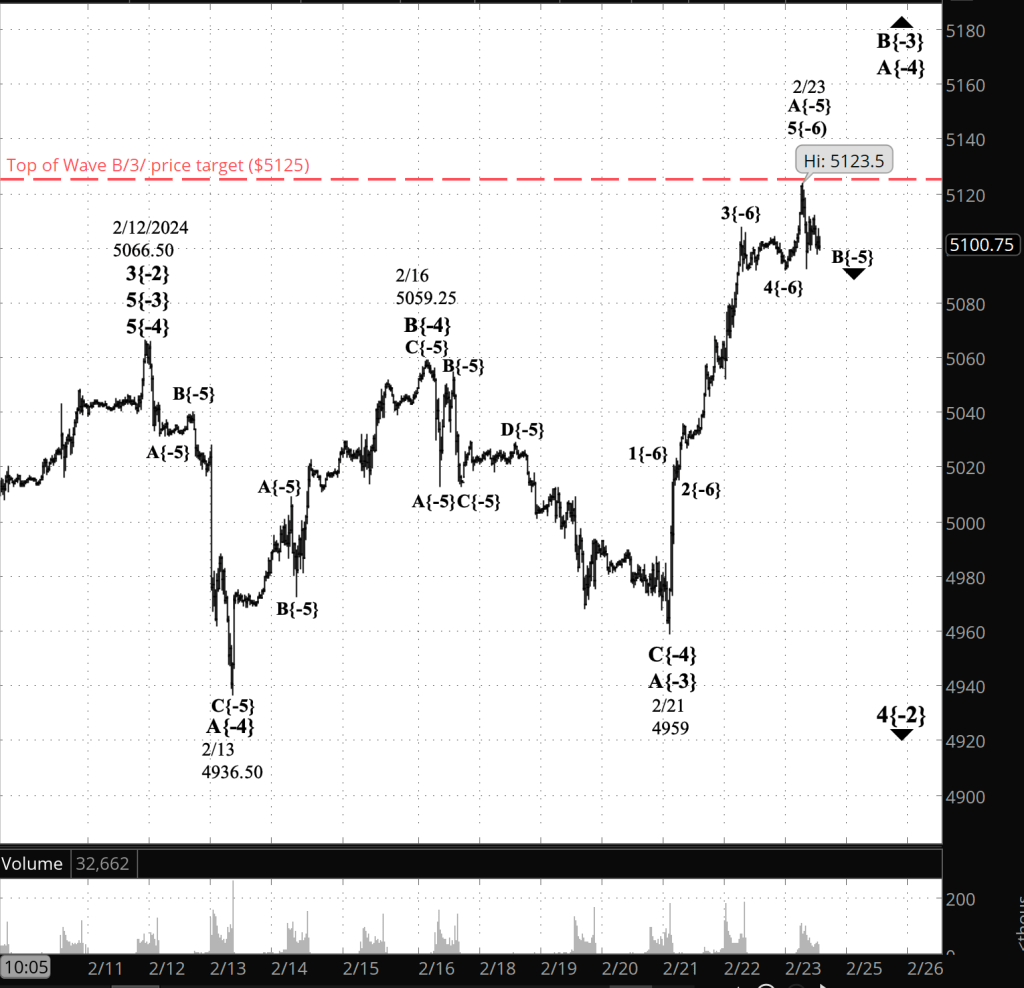
[S&P 500 E-mini futures at 9:35 a.m., 25-minute bars, with volume]
What does Elliott wave theory say? Here are the waves that underly the analyses.
Principal Analysis:
- Wave 5{0}, an expanding Diagonal Triangle, began on December 26, 2018.
- Within it, an uptrend, wave 5{-1}, began on October 13, 2022 and is underway.
- Wave 5{-1} is the parent wave of a downward correction, wave 4{-2}, that began on February 12, 2024.
- Wave 4{-2} is in its second subwave, wave B{-3}, which in turn is in wave B{-4}, its middle subwave.
We Are Here.
These are the waves currently in progress under my principal analysis. Each line on the list shows the wave number, with the subscript in curly brackets, the traditional degree name, the starting date, the starting price of the S&P 500 E-mini futures, and the direction of the wave.
- S&P 500 Index:
- 5{+3} Supercycle, 7/8/1932, 4.40 (up)
- 5{+2} Cycle, 12/9/1974, 60.96 (up)
- 5{+1} Primary, 3/6/2009, 666.79 (up)
- 5{0} Intermediate, 12/26/2018, 2346.58 (up)
- S&P 500 Futures and index:
- 5{-1} Minor, 10/13/2022, 3502 (up) (futures), 3491.58 (up) (index)
- S&P 500 Futures:
- 4{-2} Minute, 2/12/2024, 5066.50 (down)
- B{-3} Minuette, 2/21/2024, 4959 (up)
Reading the chart. Price movements — waves – – in Elliott wave analysis are labeled with numbers within trending waves and letters with corrective waves. The subscripts — numbers in curly brackets — designate the wave’s degree, which, in Elliott wave analysis, means the relative position of a wave within the larger and smaller structures that make up the chart. R.N. Elliott, who in the 1930s developed the form of analysis that bears his name, viewed the chart as a complex structure of smaller waves nested within larger waves, which in turn are nested within still larger waves. In mathematics it’s called a fractal structure, where at every scale the pattern is similar to the others.
Learning and other resources. Elliott wave analysis provides context, not prophecy. As the 20th century semanticist Alfred Korzybski put it in his book Science and Sanity (1933), “The map is not the territory … The only usefulness of a map depends on similarity of structure between the empirical world and the map.” And I would add, in the ever-changing markets, we can judge that similarity of structure only after the fact.
See the menu page Analytical Methods for a rundown on where to go for information on Elliott wave analysis.
By Tim Bovee, Portland, Oregon, February 23, 2024
Disclaimer
Tim Bovee, Private Trader tracks the analysis and trades of a private trader for his own accounts. Nothing in this blog constitutes a recommendation to buy or sell stocks, options or any other financial instrument. The only purpose of this blog is to provide education and entertainment.
No trader is ever 100 percent successful in his or her trades. Trading in the stock and option markets is risky and uncertain. Each trader must make trading decisions for his or her own account, and take responsibility for the consequences.
License
All content on Tim Bovee, Private Trader by Timothy K. Bovee is licensed under a Creative Commons Attribution-ShareAlike 4.0 International License.
Based on a work at www.timbovee.com.

You must be logged in to post a comment.