3:30 p.m. New York time
Half an hour before the closing bell. The S&P 500 futures moved a bit lower during the session, into the 5060s, and then returned to the 5080s, essentially going to nowhere.
The Elliott Wave Analysis is unchanged: The 4th-wave downward correction that began on February 12 continues and is in its second subwave, wave B.
I’ve updated the chart.
9:35 a.m. New York time
What’s happening now? The S&P 500 E-mini futures fluctuated from the 5070s to the 5090s overnight.
What does it mean? Elliott Wave Theory’s view of the chart is that the 4th-wave downward correction that began on February 12 continues. Typically, it will end within the range of subwave 4 within the preceding 3rd wave.
I’ve pulled back the chart for a broader view. The red line at the bottom is the upper boundary of the target price range for wave 4. The lower boundary, not visible, is 4702.
The 4th-wave correction is labeled wave 4[-2} on the chart — the wave number and a degree designator as a subscript in curly brackets showing the wave’s position within the fractal hierarchy of the chart.. See the “Reading the chart” section below for more on the chart’s labeling system.
Wave 4{-2} is in its second subwave, a rising B wave, which in turn is in its first subwav, a rising A wave.
The B wave, labeled wave B{-3} on the chart, is the one I’m keeping an eye on. When its third and final subwave, wave C{-4}, is complete, wave C{-3} will carry the price down in five subwaves.
What are the alternatives? The ambiguity, as is so often the case, likes in the degree designators. What I’m labelling as degree {-4} could instead be degree {-3}, one degree larger, pushing everything up one in the fractal hierarchy. I chose my labeling based on the consistency with the subwaves prior to the 4th-wave upward correction (wave 4{-2}), but consistency is a tendency, not a firm rule, so there’s a lack of certainty.
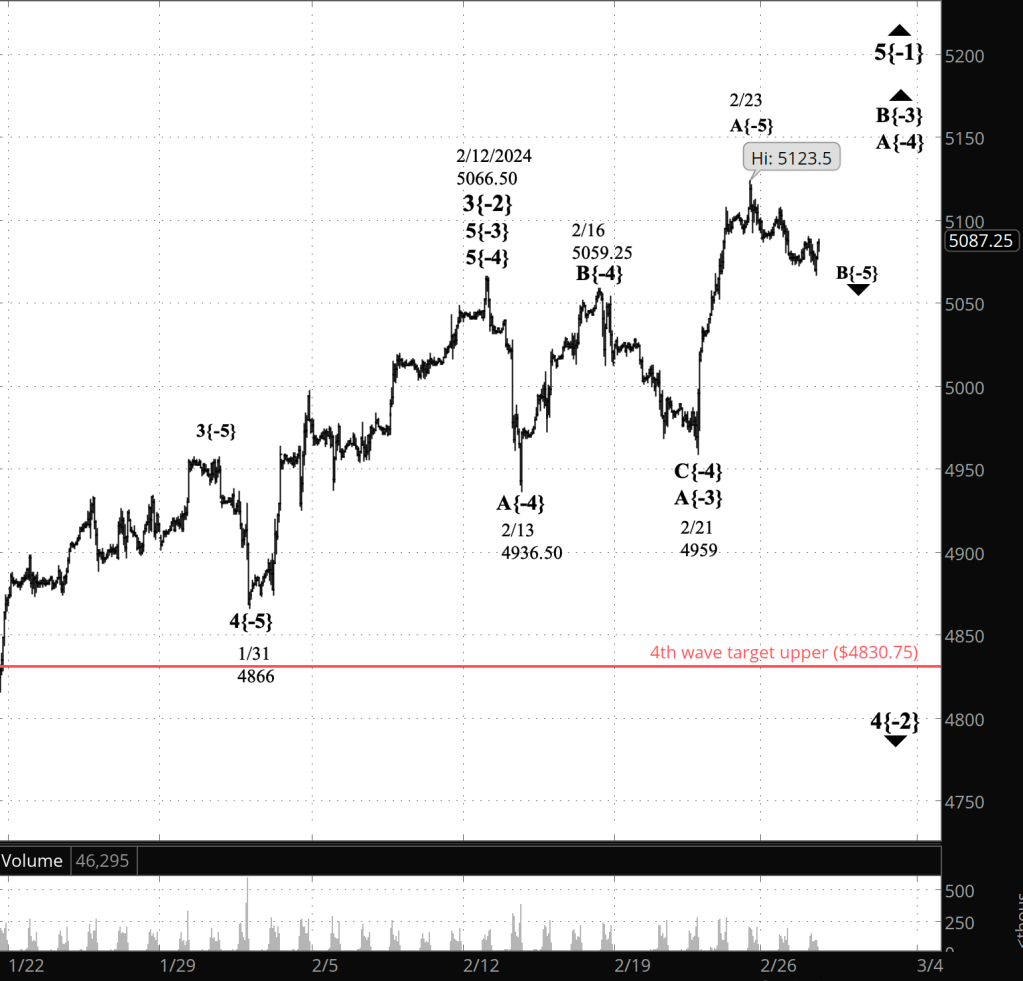
[S&P 500 E-mini futures at 3:30 p.m., 1-hour bars, with volume]
What does Elliott wave theory say? Here are the waves that underly the analyses.
Principal Analysis:
- Wave 5{0}, an expanding Diagonal Triangle, began on December 26, 2018.
- Within it, an uptrend, wave 5{-1}, began on October 13, 2022 and is underway.
- Wave 5{-1} is the parent wave of a downward correction, wave 4{-2}, that began on February 12, 2024.
- Wave 4{-2} is in its second subwave, wave B{-3}, which in turn is in wave A{-4}, its initial subwave.
- Wave A{-4} is in its middle subwave, wave B{-5}.
We Are Here.
These are the waves currently in progress under my principal analysis. Each line on the list shows the wave number, with the subscript in curly brackets, the traditional degree name, the starting date, the starting price of the S&P 500 E-mini futures, and the direction of the wave.
- S&P 500 Index:
- 5{+3} Supercycle, 7/8/1932, 4.40 (up)
- 5{+2} Cycle, 12/9/1974, 60.96 (up)
- 5{+1} Primary, 3/6/2009, 666.79 (up)
- 5{0} Intermediate, 12/26/2018, 2346.58 (up)
- S&P 500 Futures and index:
- 5{-1} Minor, 10/13/2022, 3502 (up) (futures), 3491.58 (up) (index)
- S&P 500 Futures:
- 4{-2} Minute, 2/12/2024, 5066.50 (down)
- B{-3} Minuette, 2/21/2024, 4959 (up)
Reading the chart. Price movements — waves – – in Elliott wave analysis are labeled with numbers within trending waves and letters with corrective waves. The subscripts — numbers in curly brackets — designate the wave’s degree, which, in Elliott wave analysis, means the relative position of a wave within the larger and smaller structures that make up the chart. R.N. Elliott, who in the 1930s developed the form of analysis that bears his name, viewed the chart as a complex structure of smaller waves nested within larger waves, which in turn are nested within still larger waves. In mathematics it’s called a fractal structure, where at every scale the pattern is similar to the others.
Learning and other resources. Elliott wave analysis provides context, not prophecy. As the 20th century semanticist Alfred Korzybski put it in his book Science and Sanity (1933), “The map is not the territory … The only usefulness of a map depends on similarity of structure between the empirical world and the map.” And I would add, in the ever-changing markets, we can judge that similarity of structure only after the fact.
See the menu page Analytical Methods for a rundown on where to go for information on Elliott wave analysis.
By Tim Bovee, Portland, Oregon, February 27, 2024
Disclaimer
Tim Bovee, Private Trader tracks the analysis and trades of a private trader for his own accounts. Nothing in this blog constitutes a recommendation to buy or sell stocks, options or any other financial instrument. The only purpose of this blog is to provide education and entertainment.
No trader is ever 100 percent successful in his or her trades. Trading in the stock and option markets is risky and uncertain. Each trader must make trading decisions for his or her own account, and take responsibility for the consequences.
License
All content on Tim Bovee, Private Trader by Timothy K. Bovee is licensed under a Creative Commons Attribution-ShareAlike 4.0 International License.
Based on a work at www.timbovee.com.

You must be logged in to post a comment.