3:30 p.m. New York time
Half an hour before the closing bell. The S&P 500 futures reached a peak of 5193 early in the session and then fell into the 5120s. The rising B wave that began on March 4 has three clear subwaves on the chart, as is the case with B waves, and then rapidity of the fall suggests a likelihood that the session peak marks the end of the B wave and the beginning of a decline C wave.
It remains possible that the price will reverse and move still higher, which would mean that the B wave has not yet ended.
On the chart, the waves with Elliott Wave Theory degree designators are B{-6} and C{-6}. I’ve updated the chart.
3 p.m. New York time
Trade. I’ve entered a short Iron Condor position on IWM, 42 days before expiration on April 19, with the intent of exiting at 50% or better of maximum potential profit or on management day, March 29, whichever comes first. I’ve posted an analysis of the trade.
9:35 a.m. New York time
What’s happening now? The S&P 500 E-mini futures whipsawed when the latest employment report was released, swinging from the 5150s to the 5140s and then to the 5170s, where the price settled before the opening bell.
What does it mean? In Elliott Wave Theory, the drama suggests that the rising middle subwave of a larger downward correction’s initial wave that began on March 4 is not yet complete…
What are the alternatives? … although, any high attained overnight or during the session could very well be the middle wave’s endpoint.
Whether the principal analysis or the alternative, these are small waves, buried within the 4th-wave downward correction that began on February 12. That larger 4th wave has a target range between 4830.75, the upper boundary shown in red on the chart, and 4702, the lower boundary.
Also, it’s possible that the placement of the waves within the fractal structure of the chart will need to be adjusted at some point.
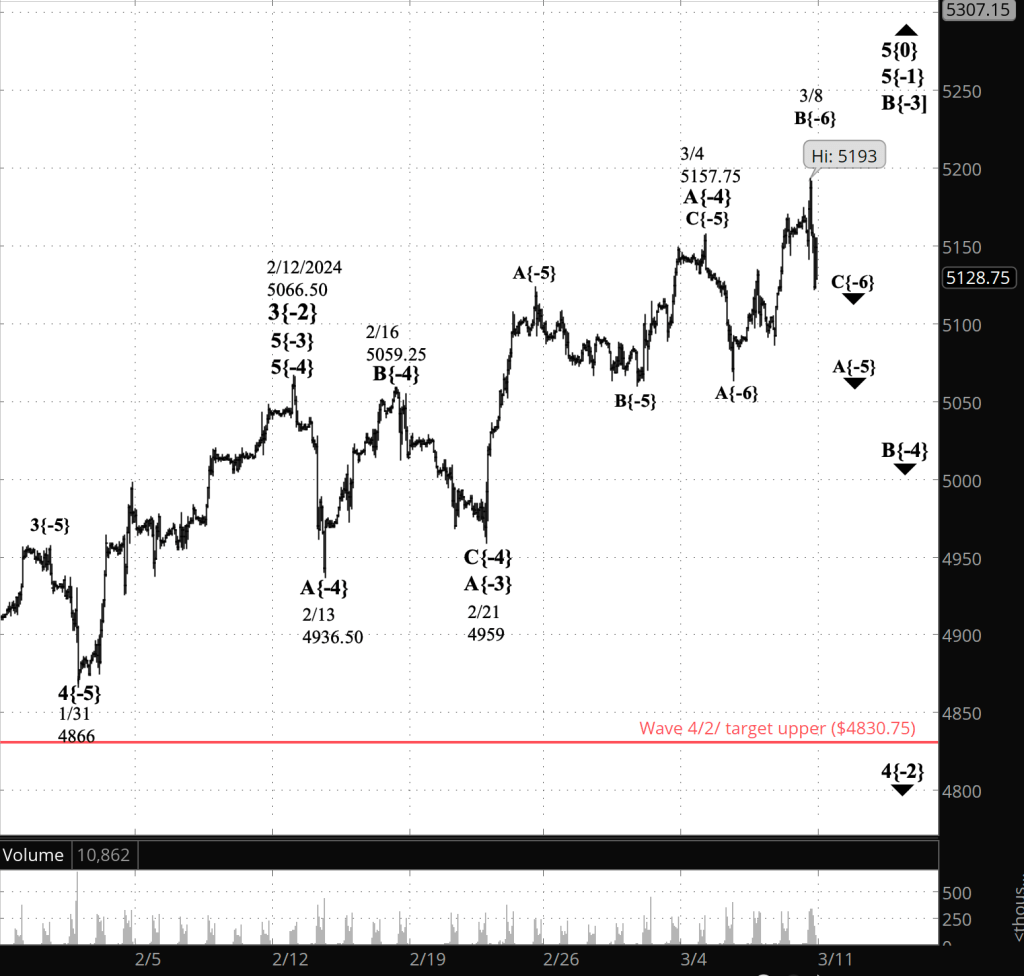
[S&P 500 E-mini futures at 3:30 p.m., 70-minute bars, with volume]
What does Elliott wave theory say? Here are the waves that underly the analyses.
Principal Analysis:
- Wave 5{0}, an expanding Diagonal Triangle, began on December 26, 2018.
- Within it, an uptrend, wave 5{-1}, began on October 13, 2022 and is underway.
- Wave 5{-1} is the parent wave of a downward correction, wave 4{-2}, that began on February 12, 2024.
- Wave 4{-2} is in its second subwave, wave B{-3}, which in turn is in wave B{-4}, its middle subwave.
- Wave B{-4} is in its initial subwave, wave A{-5}.
- Internally, wave A{-5} is in its second subwave, wave B{-6}.
We Are Here.
These are the waves currently in progress under my principal analysis. Each line on the list shows the wave number, with the subscript in curly brackets, the traditional degree name, the starting date, the starting price of the S&P 500 E-mini futures, and the direction of the wave.
- S&P 500 Index:
- 5{+3} Supercycle, 7/8/1932, 4.40 (up)
- 5{+2} Cycle, 12/9/1974, 60.96 (up)
- 5{+1} Primary, 3/6/2009, 666.79 (up)
- 5{0} Intermediate, 12/26/2018, 2346.58 (up)
- S&P 500 Futures and index:
- 5{-1} Minor, 10/13/2022, 3502 (up) (futures), 3491.58 (up) (index)
- S&P 500 Futures:
- 4{-2} Minute, 2/12/2024, 5066.50 (down)
- B{-3} Minuette, 2/21/2024, 4959 (up)
Reading the chart. Price movements — waves – – in Elliott wave analysis are labeled with numbers within trending waves and letters with corrective waves. The subscripts — numbers in curly brackets — designate the wave’s degree, which, in Elliott wave analysis, means the relative position of a wave within the larger and smaller structures that make up the chart. R.N. Elliott, who in the 1930s developed the form of analysis that bears his name, viewed the chart as a complex structure of smaller waves nested within larger waves, which in turn are nested within still larger waves. In mathematics it’s called a fractal structure, where at every scale the pattern is similar to the others.
Learning and other resources. Elliott wave analysis provides context, not prophecy. As the 20th century semanticist Alfred Korzybski put it in his book Science and Sanity (1933), “The map is not the territory … The only usefulness of a map depends on similarity of structure between the empirical world and the map.” And I would add, in the ever-changing markets, we can judge that similarity of structure only after the fact.
See the menu page Analytical Methods for a rundown on where to go for information on Elliott wave analysis.
By Tim Bovee, Portland, Oregon, March 8, 2024
Disclaimer
Tim Bovee, Private Trader tracks the analysis and trades of a private trader for his own accounts. Nothing in this blog constitutes a recommendation to buy or sell stocks, options or any other financial instrument. The only purpose of this blog is to provide education and entertainment.
No trader is ever 100 percent successful in his or her trades. Trading in the stock and option markets is risky and uncertain. Each trader must make trading decisions for his or her own account, and take responsibility for the consequences.
License
All content on Tim Bovee, Private Trader by Timothy K. Bovee is licensed under a Creative Commons Attribution-ShareAlike 4.0 International License.
Based on a work at www.timbovee.com.

You must be logged in to post a comment.