3:30 p.m. New York time
Half an hour before the closing bell. The S&P 500 futures rose slightly during the session, reaching a new high in the 5240s so far. The small rising B-wave buried deep in the ongoing 4th-wave upward correction continues. I’ve updated the chart.
9:35 a.m. New York time
What’s happening now? The S&P 500 E-mini futures whipsawed when the Consumer Price Index was released, before the opening bell. The price ended up at a new high in the 5220s.
What does it mean? The new high confirmed that, at a low degree, the rising B wave that began on March 5 is still underway. That small B wave and its parent wave are seeking a top. Whenever they appear to have found it, they pull a surprise.
Elliott Wave Theory shows the small B wave — wave B{-6} on the chart — is in its fifth and final subwave.
This is all happening within a downward correction four degrees larger, wave 4{-2} on the chart, which began on February 12.
What are the alternatives? The chart continues to look unbalanced to me, and I’ll continue searching outr alternatives to test, all of which involve changing the degree designation for various groups of waves. That is to say, changing their place within the fractal structure of the chart.
On the chart, the degree designation appears as a subscript, within curly brackets, showing the wave’s position in the fractal hierarchy relative to the Intermediate degree, which is presently wave 5{0}, an expanding Diagonal Triangle that began on December 26, 2018.
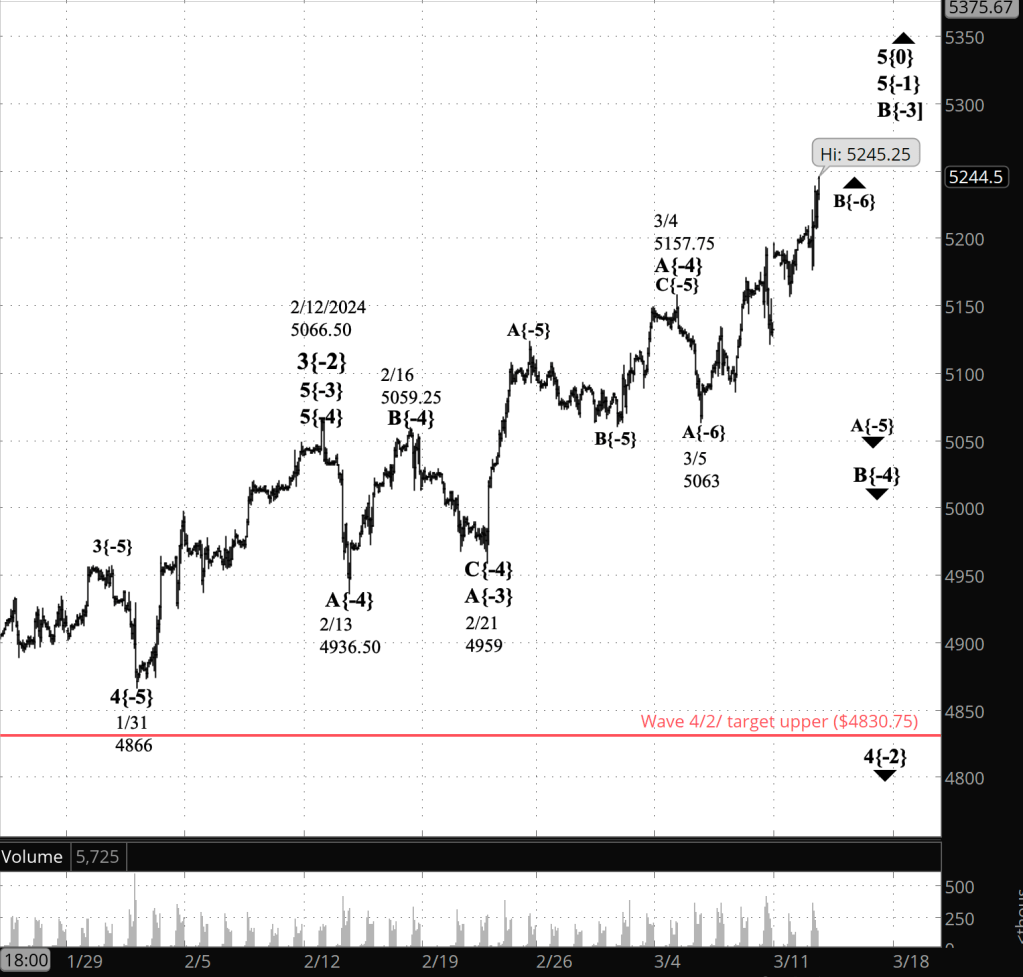
[S&P 500 E-mini futures at 3:30 p.m., 80-minute bars, with volume]
What does Elliott wave theory say? Here are the waves that underly the analyses.
Principal Analysis:
- Wave 5{0}, an expanding Diagonal Triangle, began on December 26, 2018.
- Within it, an uptrend, wave 5{-1}, began on October 13, 2022 and is underway.
- Wave 5{-1} is the parent wave of a downward correction, wave 4{-2}, that began on February 12, 2024.
- Wave 4{-2} is in its second subwave, wave B{-3}, which in turn is in wave B{-4}, its middle subwave.
- Wave B{-4} is in its initial subwave, wave A{-5}.
- Internally, wave A{-5} is in its middle subwave, wave B{-6}.
We Are Here.
These are the waves currently in progress under my principal analysis. Each line on the list shows the wave number, with the subscript in curly brackets, the traditional degree name, the starting date, the starting price of the S&P 500 E-mini futures, and the direction of the wave.
- S&P 500 Index:
- 5{+3} Supercycle, 7/8/1932, 4.40 (up)
- 5{+2} Cycle, 12/9/1974, 60.96 (up)
- 5{+1} Primary, 3/6/2009, 666.79 (up)
- 5{0} Intermediate, 12/26/2018, 2346.58 (up)
- S&P 500 Futures and index:
- 5{-1} Minor, 10/13/2022, 3502 (up) (futures), 3491.58 (up) (index)
- S&P 500 Futures:
- 4{-2} Minute, 2/12/2024, 5066.50 (down)
- B{-3} Minuette, 2/21/2024, 4959 (up)
Reading the chart. Price movements — waves – – in Elliott wave analysis are labeled with numbers within trending waves and letters with corrective waves. The subscripts — numbers in curly brackets — designate the wave’s degree, which, in Elliott wave analysis, means the relative position of a wave within the larger and smaller structures that make up the chart. R.N. Elliott, who in the 1930s developed the form of analysis that bears his name, viewed the chart as a complex structure of smaller waves nested within larger waves, which in turn are nested within still larger waves. In mathematics it’s called a fractal structure, where at every scale the pattern is similar to the others.
Learning and other resources. Elliott wave analysis provides context, not prophecy. As the 20th century semanticist Alfred Korzybski put it in his book Science and Sanity (1933), “The map is not the territory … The only usefulness of a map depends on similarity of structure between the empirical world and the map.” And I would add, in the ever-changing markets, we can judge that similarity of structure only after the fact.
See the menu page Analytical Methods for a rundown on where to go for information on Elliott wave analysis.
By Tim Bovee, Portland, Oregon, March 12, 2024
Disclaimer
Tim Bovee, Private Trader tracks the analysis and trades of a private trader for his own accounts. Nothing in this blog constitutes a recommendation to buy or sell stocks, options or any other financial instrument. The only purpose of this blog is to provide education and entertainment.
No trader is ever 100 percent successful in his or her trades. Trading in the stock and option markets is risky and uncertain. Each trader must make trading decisions for his or her own account, and take responsibility for the consequences.
License
All content on Tim Bovee, Private Trader by Timothy K. Bovee is licensed under a Creative Commons Attribution-ShareAlike 4.0 International License.
Based on a work at www.timbovee.com.

You must be logged in to post a comment.