3:30 p.m. New York time
Half an hour before the closing bell. The S&P 500 futures rose during the session, so far reaching into the 5230s. The price has remained below the March 14 high, 5253.50.
The pattern of the rise is consistent with both the subwaves within the a rising B wave within an upward correction and the early waves of the resumption of an uptrend. I’ve chosen the retain the principal analysis from this morning: A low degree 4th-wave downward correction is underway. An alternative analysis, a low-degree 5th-wave uptrend has begun. A move above 5253.50 will settle the matter in favor of the alternative. A move below the March 13 low, 5167.75, will suggest that the principal analysis is correct.
I’ve updated the chart.
9:35 a.m. New York time
What’s happening now? The S&P 500 E-mini futures fell overnight, from 5219.25 to the 5180s.
What does it mean? The rise that began on March 5, a 3rd wave according to Elliott Wave Theory, has completed its 3rd subwave and is now in a downward 4th-wave correction of lower degree. The small 4th-wave correction show three subwaves — the pattern for most corrections — and may be complete, which would mean that a small 5th-wave rise is underway. The 5th wave will complete its parent 3rd wave, and another downward 4th-wave correction will ensue.
If the price moves below 5167.75, the low of March 15, that’s a signal that the 4th-wave correction of lower degree is still underway.
The chart below shows the waves, numbered according to Elliott Wave Theory, with their degrees designated by subscripts in curly brackets showing the wave’s place within the fractal hierarchy of the price movements in relation to a much larger wave of {0} degree, an Intermediate degree in Elliott Wave terminology. The smaller the subscript, the lower the degree. See the “Reading the chart” section below for more on degrees.
In this case, the wave of lowest degree discussed above is wave 4{-6}, a downward correction within uptrending wave 3{-5}, which began on March 5.
This is all happening within wave 3{-2}, an uptrend several degrees larger that began on January 17.
What are the alternatives? There is uncertainty over the proper place of the waves within the fractal structure of the chart, their degree, in Elliott Wave terminology. Those ambiguities will be resolved as the present trend works its way forward.
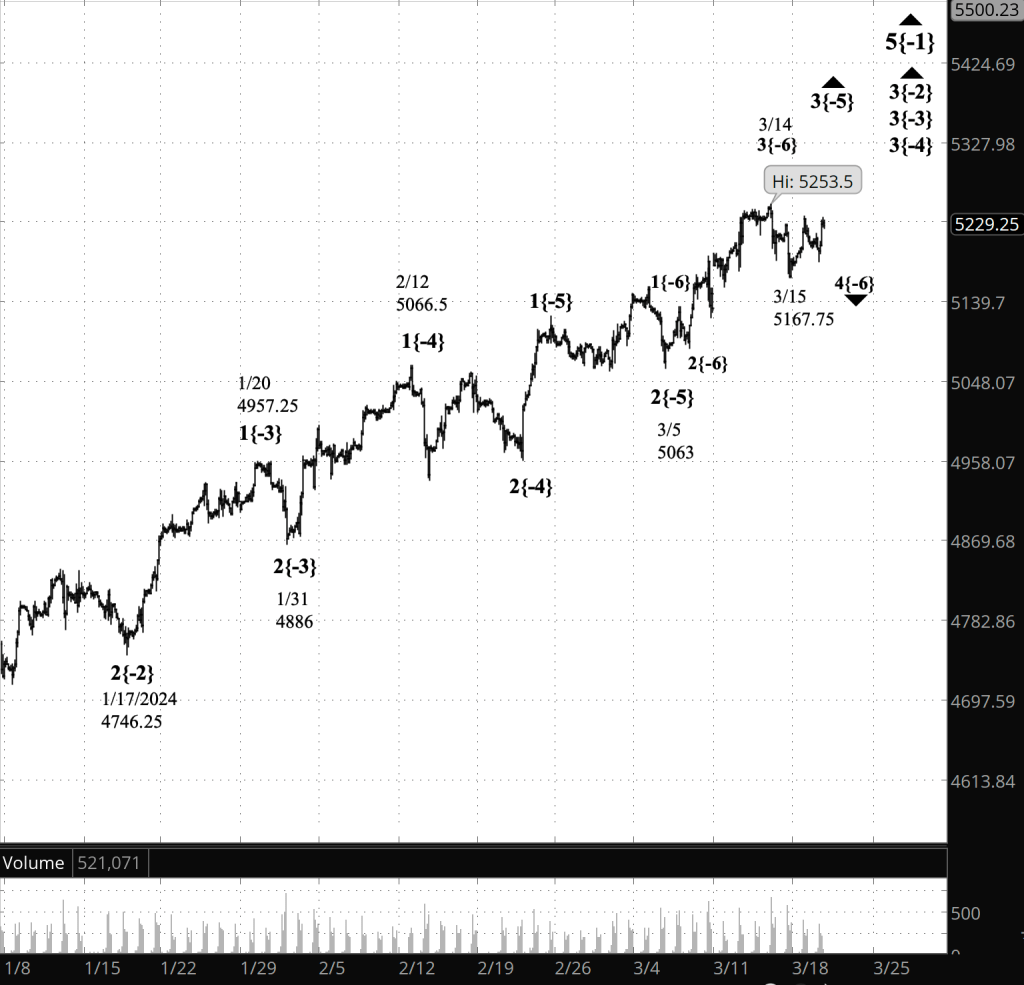
[S&P 500 E-mini futures at 3:30 p.m., 2-hour bars, with volume]
What does Elliott wave theory say? Here are the waves that underly the analyses.
Principal Analysis:
- Rising wave 5{0} is underway.
- It is in its final subwave, wave 5{-1}
- Within wave 5{-1}, rising waves 3{-2}, 3{-3} and 3{-4} are underway, as is the smallest wave labeled on the chart, wave 3{-5}.
- Wave 3{-5} is in its 4th subwave, wave 4{-6}, and may have completed it.
- If wave 4{-6} is complete, then uptrending wave 5{-6} is underway.
Reading the chart. Price movements — waves – – in Elliott wave analysis are labeled with numbers within trending waves and letters with corrective waves. The subscripts — numbers in curly brackets — designate the wave’s degree, which, in Elliott wave analysis, means the relative position of a wave within the larger and smaller structures that make up the chart. R.N. Elliott, who in the 1930s developed the form of analysis that bears his name, viewed the chart as a complex structure of smaller waves nested within larger waves, which in turn are nested within still larger waves. In mathematics it’s called a fractal structure, where at every scale the pattern is similar to the others.
Learning and other resources. Elliott wave analysis provides context, not prophecy. As the 20th century semanticist Alfred Korzybski put it in his book Science and Sanity (1933), “The map is not the territory … The only usefulness of a map depends on similarity of structure between the empirical world and the map.” And I would add, in the ever-changing markets, we can judge that similarity of structure only after the fact.
See the menu page Analytical Methods for a rundown on where to go for information on Elliott wave analysis.
By Tim Bovee, Portland, Oregon, March 19, 2024
Disclaimer
Tim Bovee, Private Trader tracks the analysis and trades of a private trader for his own accounts. Nothing in this blog constitutes a recommendation to buy or sell stocks, options or any other financial instrument. The only purpose of this blog is to provide education and entertainment.
No trader is ever 100 percent successful in his or her trades. Trading in the stock and option markets is risky and uncertain. Each trader must make trading decisions for his or her own account, and take responsibility for the consequences.
License
All content on Tim Bovee, Private Trader by Timothy K. Bovee is licensed under a Creative Commons Attribution-ShareAlike 4.0 International License.
Based on a work at www.timbovee.com.

You must be logged in to post a comment.