3:30 p.m. New York time
Half an hour before the closing bell. The S&P 500 futures rose sharply when the Federal Open Market Committee released its statement, keeping rates steady.
The rise moved above the March 14 peak, resolving the ambiguity discussed in this morning’s analysis.
A low-degree 4th-wave downward correction — wave 4{-6} on the chart — ended on March 15, and a 5th-wave uptrend — wave 5{-6} — began, reaching into the 5270s.
When the 5th wave is complete, it will also mean the completion of its parent, wave 3{-5}, which will be followed by another 4th-wave downward correction, one degree larger than the one that ended on March 15.
I’ve updated the chart.
9:35 a.m. New York time
What’s happening now? The S&P 500 E-mini futures reached a high in the 5240 in overnight trading and then declined.
What does it mean? In Elliott Wave Theory, the chart has two possible interpretations, of equal likelihood. One has a low-degree 4th-wave downward correction underway and its middle subwave, a rising B wave. The other has the low of 5167.75 as the end of the correction and the subsequent rise as the early subwaves within a 5th-wave uptrend.
Whichever is correct, it is all taking place within a larger rising 3rd wave, which in turn is a subwave of a series of 3rd waves of larger degree, all within a 5th wave uptrend that began on October 27, 2023.
How do we determine which interpretation best matches the chart? As always with Elliott Wave analysis, time will tell. If the price moves below 5167.75, the March 15 end of the preceding low-degree A wave, then the 4th-wave downward correction is continuing. If the price moves above 5253.50, the March 14 beginning of the 4th-wave downward correction, then the 4th wave ended on March 15 and the 5th wave began on that date and is underway.
What are the alternatives? There is uncertainty over the proper place of the waves within the fractal structure of the chart, their degree, in Elliott Wave terminology. For example, is wave 5{-1} on the chart really of that degree, or is it a degree higher, or lower. Those ambiguities will be resolved as the present trend works its way forward.
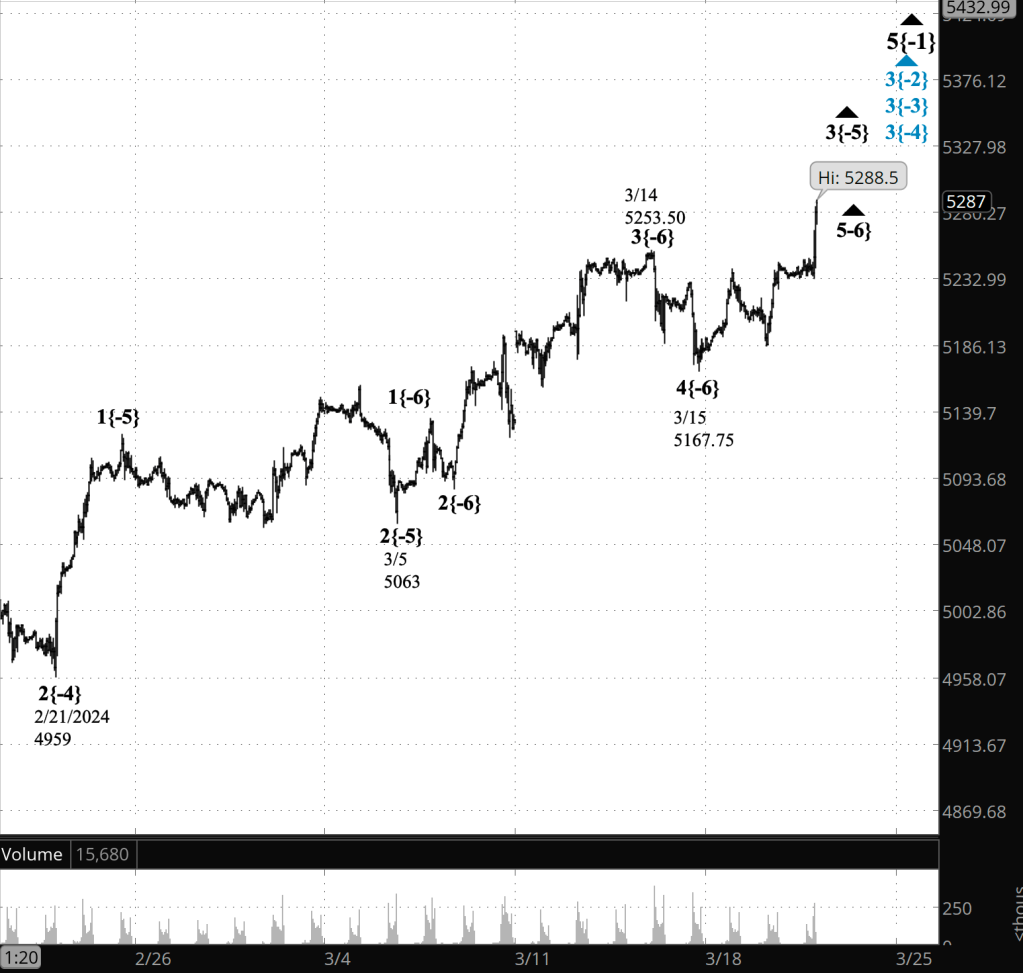
[S&P 500 E-mini futures at 3:30 p.m., 50-minute bars, with volume]
What does Elliott wave theory say? Here are the waves that underly the analyses.
Principal Analysis:
- Rising wave 5{0} is underway.
- It is in its final subwave, wave 5{-1}
- Within wave 5{-1}, rising waves 3{-2}, 3{-3} and 3{-4} are underway, as is the smallest wave labeled on the chart, wave 3{-5}.
- Wave 3{-5} is in its 4th subwave, wave 4{-6}, and may have completed it.
- If wave 4{-6} is complete, then uptrending wave 5{-6} is underway.
Reading the chart. Price movements — waves – – in Elliott wave analysis are labeled with numbers within trending waves and letters with corrective waves. The subscripts — numbers in curly brackets — designate the wave’s degree, which, in Elliott wave analysis, means the relative position of a wave within the larger and smaller structures that make up the chart. R.N. Elliott, who in the 1930s developed the form of analysis that bears his name, viewed the chart as a complex structure of smaller waves nested within larger waves, which in turn are nested within still larger waves. In mathematics it’s called a fractal structure, where at every scale the pattern is similar to the others.
Learning and other resources. Elliott wave analysis provides context, not prophecy. As the 20th century semanticist Alfred Korzybski put it in his book Science and Sanity (1933), “The map is not the territory … The only usefulness of a map depends on similarity of structure between the empirical world and the map.” And I would add, in the ever-changing markets, we can judge that similarity of structure only after the fact.
See the menu page Analytical Methods for a rundown on where to go for information on Elliott wave analysis.
By Tim Bovee, Portland, Oregon, March 20, 2024
Disclaimer
Tim Bovee, Private Trader tracks the analysis and trades of a private trader for his own accounts. Nothing in this blog constitutes a recommendation to buy or sell stocks, options or any other financial instrument. The only purpose of this blog is to provide education and entertainment.
No trader is ever 100 percent successful in his or her trades. Trading in the stock and option markets is risky and uncertain. Each trader must make trading decisions for his or her own account, and take responsibility for the consequences.
License
All content on Tim Bovee, Private Trader by Timothy K. Bovee is licensed under a Creative Commons Attribution-ShareAlike 4.0 International License.
Based on a work at www.timbovee.com.

You must be logged in to post a comment.