3:30 p.m. New York time
Half an hour before the closing bell. The S&P 500 futures continued to gradually work their way lower during the session. Elliott Wave Theory sees the decline as forming a clear five-subwave pattern, indicating that the 4th-wave downward correction that began on March 21 has entered a C wave, the final subwave of three. This morning’s 4th-wave-continues analysis stands, although the subwave labeling has been updated, as has the chart.
9:35 a.m. New York time
What’s happening now? The S&P 500 E-mini futures rose overnight to 5300 and then pulled back slightly.
What does it mean? Viewed through the lens of Elliott Wave Theory, the pattern is ambiguous. Either the rise is a B-wave with three subwaves within its parent, a low-degree 4th-wave downward correction that began on March 21. Or the 4th wave ended on March 25 and the next wave, a 5th-wave uptrend, has begun.
I’m leaning toward the 4th-wave-continues analysis. The decline from March 21 to March 25 is best seen as having five subwaves, as is proper for the A wave of a Zigzag correction. I see no clear three subwave pattern, a requirement for the 5th-wave-begins analysis.
What are the alternatives? None beyond what was discussed above. Other ambiguities, without a doubt, will appear.
The Chart. I’ve moved the chart closer in so as to see greater detail in the 4th-wave downward correction — wave 4{-7} on the chart. See reading the “Reading the chart” section below for an explanation of the subscripts in curly brackets, which give each wave’s relationship to a much larger degree, the Intermediate degree, which is presently wave 5{0}, which began in December 2018.
Wave A{-8} on the chart lacks clarity in its subwaves. I’ve numbered them, waves 1{-9} through 5{-9}, but with little confidence. There are other readings possible.
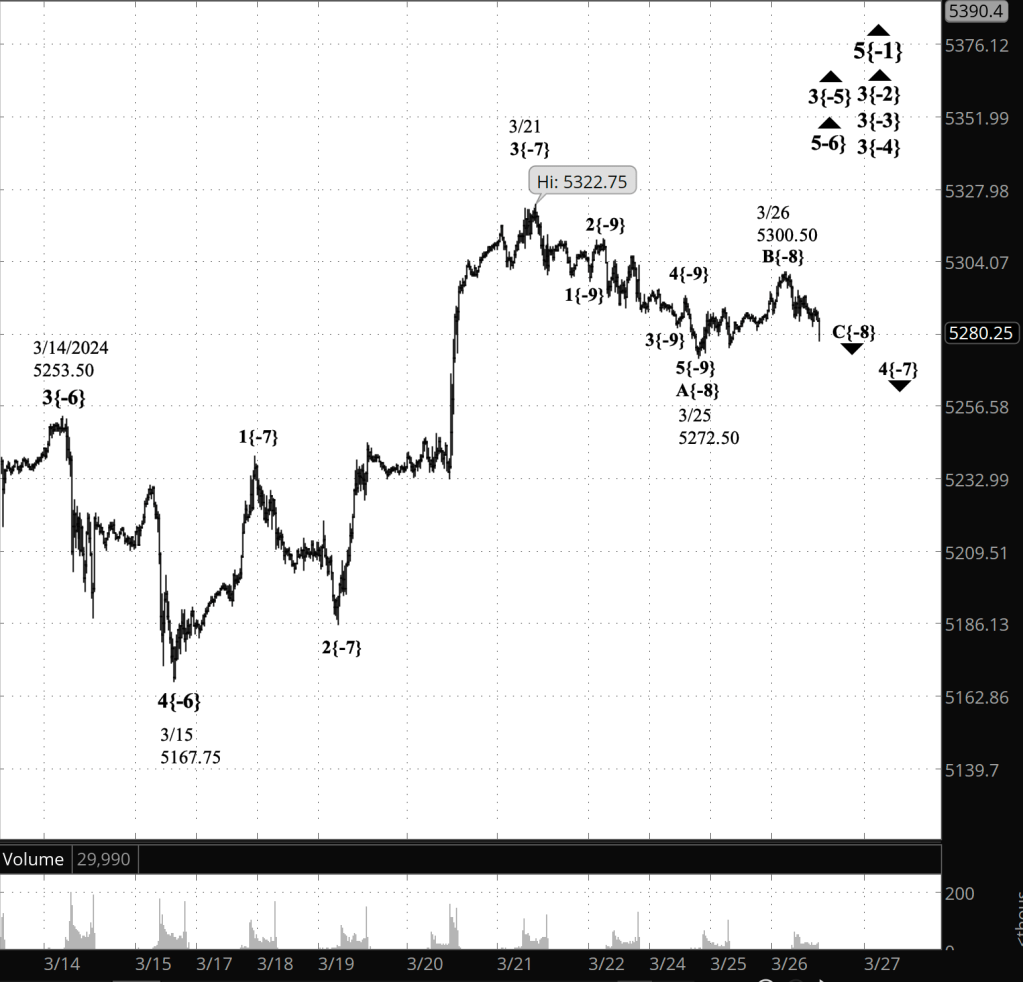
[S&P 500 E-mini futures at 3:30 p.m., 20-minute bars, with volume]
What does Elliott wave theory say? Here are the waves that underly the analyses.
Principal Analysis:
- Rising wave 5{0} is underway.
- It is in its final subwave, wave 5{-1}
- Within wave 5{-1}, rising waves 3{-2}, 3{-3} and 3{-4} are underway, as is the smallest wave labeled on the chart, wave 3{-5}.
- Wave 3{-5} is in its 5th subwave, wave 5{-6}
- Within wave 5{-6}, the next-to-the-last subwave, wave 4{-7}, is underway.
- Wave B{-8}, the middle of three subwaves within wave 4{-7}, began on March 25 and may have ended on March 26 at the overnight high, 5300.50, the end of wave C{-9}. Or perhaps not. The high could instead be the end of rising wave A{-9}, and the subsequent decline the beginning of falling wave B{-9}.
Reading the chart. Price movements — waves – – in Elliott wave analysis are labeled with numbers within trending waves and letters with corrective waves. The subscripts — numbers in curly brackets — designate the wave’s degree, which, in Elliott wave analysis, means the relative position of a wave within the larger and smaller structures that make up the chart. R.N. Elliott, who in the 1930s developed the form of analysis that bears his name, viewed the chart as a complex structure of smaller waves nested within larger waves, which in turn are nested within still larger waves. In mathematics it’s called a fractal structure, where at every scale the pattern is similar to the others.
Learning and other resources. Elliott wave analysis provides context, not prophecy. As the 20th century semanticist Alfred Korzybski put it in his book Science and Sanity (1933), “The map is not the territory … The only usefulness of a map depends on similarity of structure between the empirical world and the map.” And I would add, in the ever-changing markets, we can judge that similarity of structure only after the fact.
See the menu page Analytical Methods for a rundown on where to go for information on Elliott wave analysis.
By Tim Bovee, Portland, Oregon, March 26, 2024
Disclaimer
Tim Bovee, Private Trader tracks the analysis and trades of a private trader for his own accounts. Nothing in this blog constitutes a recommendation to buy or sell stocks, options or any other financial instrument. The only purpose of this blog is to provide education and entertainment.
No trader is ever 100 percent successful in his or her trades. Trading in the stock and option markets is risky and uncertain. Each trader must make trading decisions for his or her own account, and take responsibility for the consequences.
License
All content on Tim Bovee, Private Trader by Timothy K. Bovee is licensed under a Creative Commons Attribution-ShareAlike 4.0 International License.
Based on a work at www.timbovee.com.

You must be logged in to post a comment.