3:30 p.m. New York time
Half an hour before the closing bell. The S&P 500 futures continued to decline early in the session, reaching into the 5230s. The price then began a sideways pattern.
Applying Elliott Wave Theory, Wave A, the first wave of a 4th-wave downward correction, is underway. Internally, it is in its 3rd subwave, which is either the final wave within the A wave, meaning the correction is taking the form of a Flat, or the middle wave of five total, meaning the correction is taking the form of a Zigzag.
If it’s a Flat, the pause in the decline could be the first steps of a rising B wave, the 2nd subwave of the correction. If it’s a Zigzag, then the pause is a correction within declining wave A, the 1st subwave of the correction.
I’ve updated the chart.
9:35 a.m. New York time
What’s happening now? The S&P 500 E-mini futures continued to fall overnight, reaching into the 5250s.
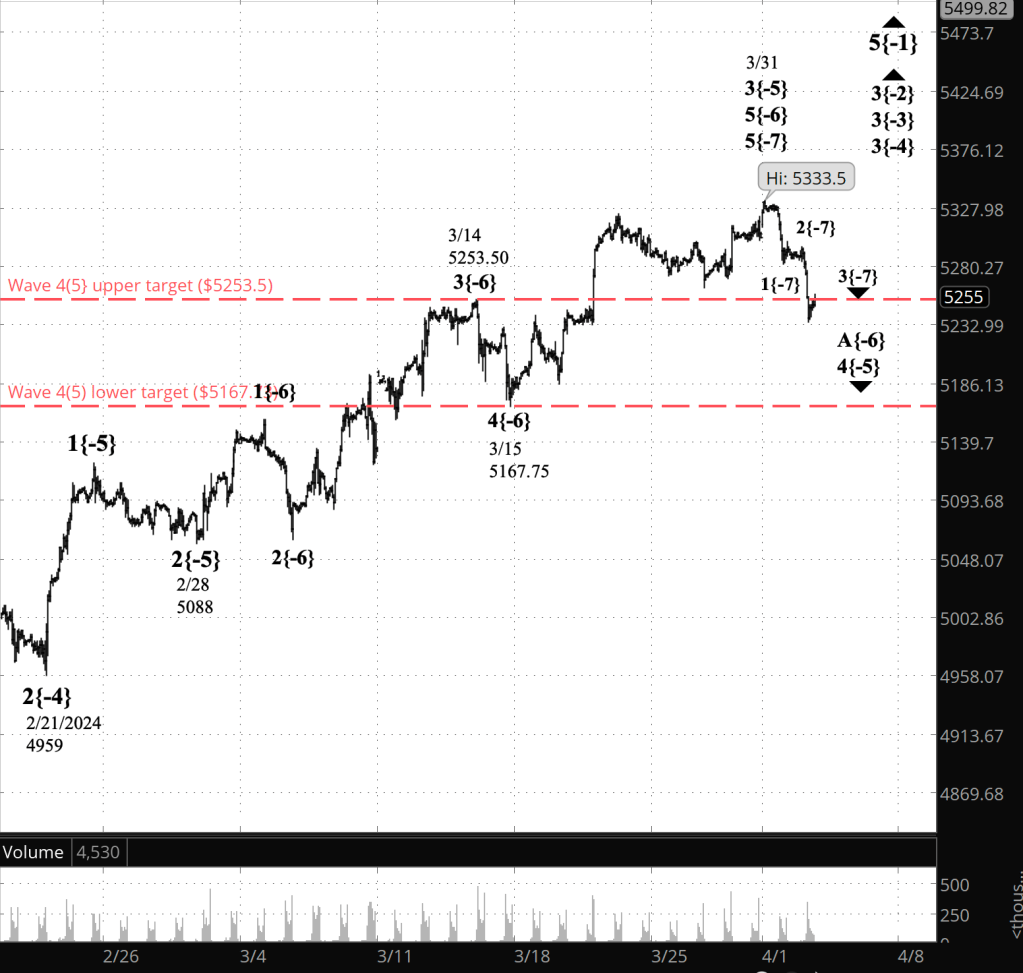
What does it mean? The fall brought the price into the price target range for the 4th-wave downward correction that began on March 31. The target range runs from 5253.50 to 5167 and is marked by red dashed lines on the chart.
The correction is in its first subwave — wave A. The overnight decline is the 5th and final subwave of the A wave. When the A wave is complete, it will be followed by a rising wave B, which under a rule of Elliott Wave Theory never moves above the starting point of the preceding A wave. So 5333.50 is a firm cap on how far the B wave can travel. A final wave C will complete the correction. C waves almost always are longer than the preceding A wave.
All of this is happening on a relative small scale within the fractal structure of the chart. The 4th wave correction is a subwave of a larger 3rd-wave uptrend, which in turn is nested within three more layers of subwaves, all of 3rd waves. The way the chart will play out for awhile will be a series of 3rd waves ending, triggering a 4th wave correction.
The wave numbers in the upper right-hand corner of the chart have subscripts in curly brackets showing the relative position of the wave within the fractal structure.
What are the alternatives? I’ve number the correction as though the decline is an A wave, a subwave one degree lower than the 4th-wave correction. But is it really? Could it be two degrees lower, making it a subwave of the A wave? Only time will resolve the ambiguity.
[S&P 500 E-mini futures at 3:30 p.m., 70-minute bars, with volume]
What does Elliott wave theory say? Here are the waves that underly the analyses.
Principal Analysis:
- Rising wave 5{0} is underway.
- It is in its final subwave, wave 5{-1}
- Within wave 5{-1}, rising waves 3{-2}, 3{-3} and 3{-4} are underway, as is the smallest wave labeled on the chart, wave 3{-5}.
- Downtrending wave 4{-5} is in its 1st subwave, wave A{-6}, which in turn is in its 5th and final subwave, wave 5{-7}.
Reading the chart. Price movements — waves – – in Elliott wave analysis are labeled with numbers within trending waves and letters with corrective waves. The subscripts — numbers in curly brackets — designate the wave’s degree, which, in Elliott wave analysis, means the relative position of a wave within the larger and smaller structures that make up the chart. R.N. Elliott, who in the 1930s developed the form of analysis that bears his name, viewed the chart as a complex structure of smaller waves nested within larger waves, which in turn are nested within still larger waves. In mathematics it’s called a fractal structure, where at every scale the pattern is similar to the others.
Learning and other resources. Elliott wave analysis provides context, not prophecy. As the 20th century semanticist Alfred Korzybski put it in his book Science and Sanity (1933), “The map is not the territory … The only usefulness of a map depends on similarity of structure between the empirical world and the map.” And I would add, in the ever-changing markets, we can judge that similarity of structure only after the fact.
See the menu page Analytical Methods for a rundown on where to go for information on Elliott wave analysis.
By Tim Bovee, Portland, Oregon, April 2, 2024
Disclaimer
Tim Bovee, Private Trader tracks the analysis and trades of a private trader for his own accounts. Nothing in this blog constitutes a recommendation to buy or sell stocks, options or any other financial instrument. The only purpose of this blog is to provide education and entertainment.
No trader is ever 100 percent successful in his or her trades. Trading in the stock and option markets is risky and uncertain. Each trader must make trading decisions for his or her own account, and take responsibility for the consequences.
License
All content on Tim Bovee, Private Trader by Timothy K. Bovee is licensed under a Creative Commons Attribution-ShareAlike 4.0 International License.
Based on a work at www.timbovee.com.

You must be logged in to post a comment.