3:30 p.m. New York time
Half an hour before the closing bell. The S&P 500 futures rose during the session and then declined a bit, as the the rising middle subwave of downward 4th-wave correction that began March 31 continues.
Elliott Wave Theory: The middle subwave, wave B, appears to in the first of three subwaves, wave A. In a Flat-pattern correction, the B-wave always retraces 90% or more of the preceding wave A. That means wave B will have an end point of 5319.25 or greater. The B-wave’s high point so far is 5272.50. For that reason, I’m not yet calling wave B as being complete. It’s maximum end point is 5333.50, no higher under a rule of EWT.
The waves under discussion as labelled on the chart: Rising wave B{-6} retracing falling wave A{-6} within the larger downward correction, wave 4{-5}.
I’ve updated the chart.
9:35 a.m. New York time
What’s happening now? The S&P 500 E-mini futures traded sideways after trading resumed overnight.
What does it mean? The price remained close to the upper boundary of the target price range of the 4th-wave downward correction that began March 31. I show the price range boundaries on the chart with red dashed lines.
Applying Elliott Wave Theory, the correction began its rising B wave — the middle of three subwaves — on April 4. Wave B will be followed by a declining C wave that will end the correction, unless the 4th wave takes a complex form, linking two or three corrective patterns, each with three subwaves, separated by an X wave. Such expanded corrections aren’t exactly rare, but they aren’t everyday occurrences. Their impact is to lengthen the time it takes for the parent correction to reach its end.
When wave 4 is complete, it will be followed by a rising wave 5 that will complete the larger 3rd-wave uptrend that began on February 21. The of the larger 3rd wave will be followed by a 4th-degree downward correction, one degree higher than the 4th-wave correction presently underway. The B wave will wave three subwaves.
The waves discussed above are labeled on the chart with a wave number and a subscript indicating how far removed the wave’s degree is within the fractal structure of the chart from the Intermediate degree.
Here are the waves under discussion, smaller degree to larger degree: Wave B{-6} within wave 4{-5} within wave 3{-4}. The Intermediate degree wave that contains them all is wave 5{0}, which began in December 2018.
What are the alternatives? The ambiguities discussed in Friday’s Trader’s Notebook seem less likely as wave 4 plays out, and I’ve dropped the alternatives from this report. However, the reality of Elliott Wave Theory is that there are always ambiguities, some less likely than others.
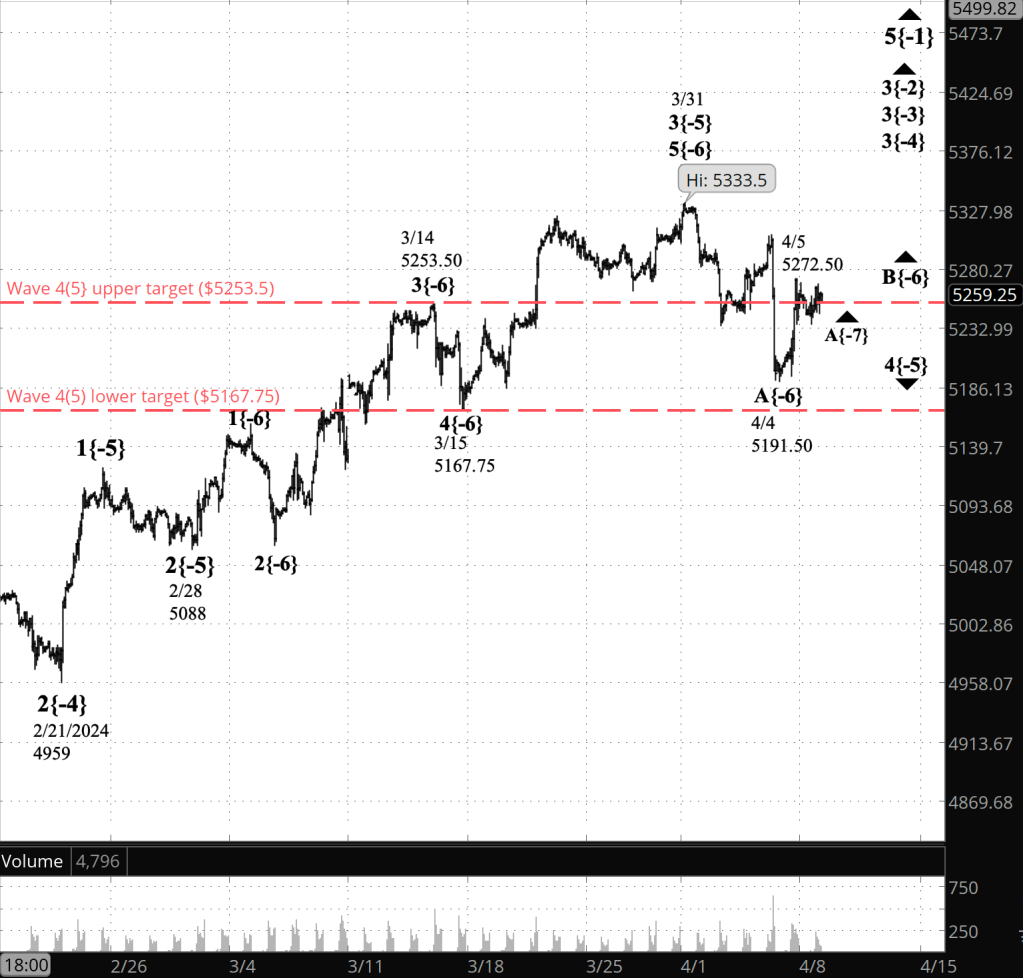
[S&P 500 E-mini futures at 3:30 p.m., 80-minute bars, with volume]
What does Elliott wave theory say? Here are the waves that underly the analyses.
Principal Analysis:
- Rising wave 5{0} is underway.
- It is in its final subwave, wave 5{-1}
- Within wave 5{-1}, rising waves 3{-2}, 3{-3} and 3{-4} are underway, as is the smallest wave labeled on the chart, wave 3{-5}.
- Downtrending wave 4{-5} is in its 2nd subwave, rising wave B{-6}.
Reading the chart. Price movements — waves – – in Elliott wave analysis are labeled with numbers within trending waves and letters with corrective waves. The subscripts — numbers in curly brackets — designate the wave’s degree, which, in Elliott wave analysis, means the relative position of a wave within the larger and smaller structures that make up the chart. R.N. Elliott, who in the 1930s developed the form of analysis that bears his name, viewed the chart as a complex structure of smaller waves nested within larger waves, which in turn are nested within still larger waves. In mathematics it’s called a fractal structure, where at every scale the pattern is similar to the others.
Learning and other resources. Elliott wave analysis provides context, not prophecy. As the 20th century semanticist Alfred Korzybski put it in his book Science and Sanity (1933), “The map is not the territory … The only usefulness of a map depends on similarity of structure between the empirical world and the map.” And I would add, in the ever-changing markets, we can judge that similarity of structure only after the fact.
See the menu page Analytical Methods for a rundown on where to go for information on Elliott wave analysis.
By Tim Bovee, Portland, Oregon, April 8, 2024
Disclaimer
Tim Bovee, Private Trader tracks the analysis and trades of a private trader for his own accounts. Nothing in this blog constitutes a recommendation to buy or sell stocks, options or any other financial instrument. The only purpose of this blog is to provide education and entertainment.
No trader is ever 100 percent successful in his or her trades. Trading in the stock and option markets is risky and uncertain. Each trader must make trading decisions for his or her own account, and take responsibility for the consequences.
License
All content on Tim Bovee, Private Trader by Timothy K. Bovee is licensed under a Creative Commons Attribution-ShareAlike 4.0 International License.
Based on a work at www.timbovee.com.

You must be logged in to post a comment.