3:30 p.m. New York time
Half an hour before the closing bell. The S&P 500 futures rose during the session, into the 5250s. The rise is wave B, the second subwave of the 4th-wave downward correction that began on March 31.
As noted this morning, the price target range for this B wave is 5234 to 5299. I’ve marked the upper and lower boundaries of the range with blue dotted lines. The session rise has brought the B wave to within that range.
The chart also shows the price target range for the 4th-wave correction, parent of the B wave, marking the upper and lower boundaries — 5253.50 and 5167.75 with red dotted lines.
Here is the labeling of the waves under discussion, with the wave numbers followed by a subscript in curly brackets show how many degrees removed from the Intermediate range the wave is.
Now underway: Rising wave B{-6}, retracing the now complete declining wave A{-6}, both subwaves of the downward correction, wave 4{-5}.12
9:35 a.m. New York time
What’s happening now? The S&P 500 E-mini futures fell overnight but rose sharply following the release of wholesale inflation data — the Producer Price Index. The PPI-inspired move carried the price from the 5170s to the 5220s.
What does it mean? Applying Elliott Wave Theory: The session low, 5173.50, remained above the lower boundary of the target price range of the 4th-wave downward correction that began on March 31. The price came close to the lower boundary, 5167.50.
The overnight decline carried the price below what had been labeled the end of the A-wave within the correction, the first of three waves, forcing a rapid reanalysis.
Here are the changes:
- The wave 4 correction is taking the form of a Zizag (not a Flat)
- Falling wave A within the correction may have ended with the overnight low, although not necessarily not on April 4).
- Rising Wave B began on April 4.
Since the correction is now clearly a Zigzag, wave B is likely to retrace between 38% and 79% of of the preceding A wave. That’s a tendency, not a firm rule. That retracement range would end wave B somewhere between 5234 and 5299.
What are the alternatives? As noted above, wave A may still be underway. I marked it as having ended because of its proximity to the lower boundary of the 4th-wave price target range.
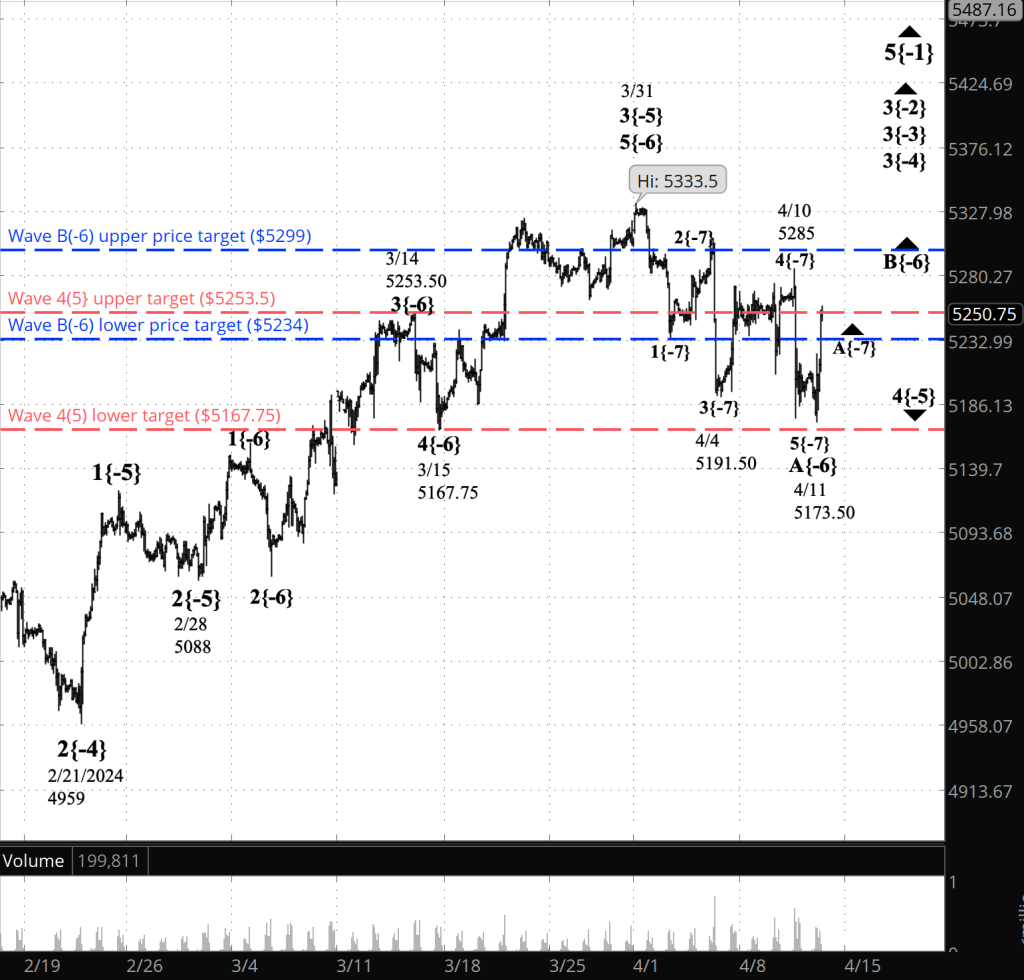
[S&P 500 E-mini futures at 3:30 p.m., 90-minute bars, with volume]
What does Elliott wave theory say? Here are the waves that underly the analyses.
Principal Analysis:
- Rising wave 5{0} is underway. It is a wave of Intermediate Degree that began in December 2018.
- It is in its final subwave, wave 5{-1}
- Within wave 5{-1}, rising waves 3{-2}, 3{-3} and 3{-4} are underway, as is the smallest wave labeled on the chart, wave 3{-5}.
- Downtrending wave 4{-5} is in its 2nd subwave, rising wave B{-6}, which just began with the overnight low that ended falling wave A[-6}, the first subwave. Wave B{-6} will have three subwaves.
Reading the chart. Price movements — waves – – in Elliott wave analysis are labeled with numbers within trending waves and letters with corrective waves. The subscripts — numbers in curly brackets — designate the wave’s degree, which, in Elliott wave analysis, means the relative position of a wave within the larger and smaller structures that make up the chart. R.N. Elliott, who in the 1930s developed the form of analysis that bears his name, viewed the chart as a complex structure of smaller waves nested within larger waves, which in turn are nested within still larger waves. In mathematics it’s called a fractal structure, where at every scale the pattern is similar to the others.
Learning and other resources. Elliott wave analysis provides context, not prophecy. As the 20th century semanticist Alfred Korzybski put it in his book Science and Sanity (1933), “The map is not the territory … The only usefulness of a map depends on similarity of structure between the empirical world and the map.” And I would add, in the ever-changing markets, we can judge that similarity of structure only after the fact.
See the menu page Analytical Methods for a rundown on where to go for information on Elliott wave analysis.
By Tim Bovee, Portland, Oregon, April 11, 2024
Disclaimer
Tim Bovee, Private Trader tracks the analysis and trades of a private trader for his own accounts. Nothing in this blog constitutes a recommendation to buy or sell stocks, options or any other financial instrument. The only purpose of this blog is to provide education and entertainment.
No trader is ever 100 percent successful in his or her trades. Trading in the stock and option markets is risky and uncertain. Each trader must make trading decisions for his or her own account, and take responsibility for the consequences.
License
All content on Tim Bovee, Private Trader by Timothy K. Bovee is licensed under a Creative Commons Attribution-ShareAlike 4.0 International License.
Based on a work at www.timbovee.com.

You must be logged in to post a comment.