3:40 p.m. New York time
Half an hour before the closing bell. The S&P 500 futures continued to fall during the session, so far reaching into the 5150s.
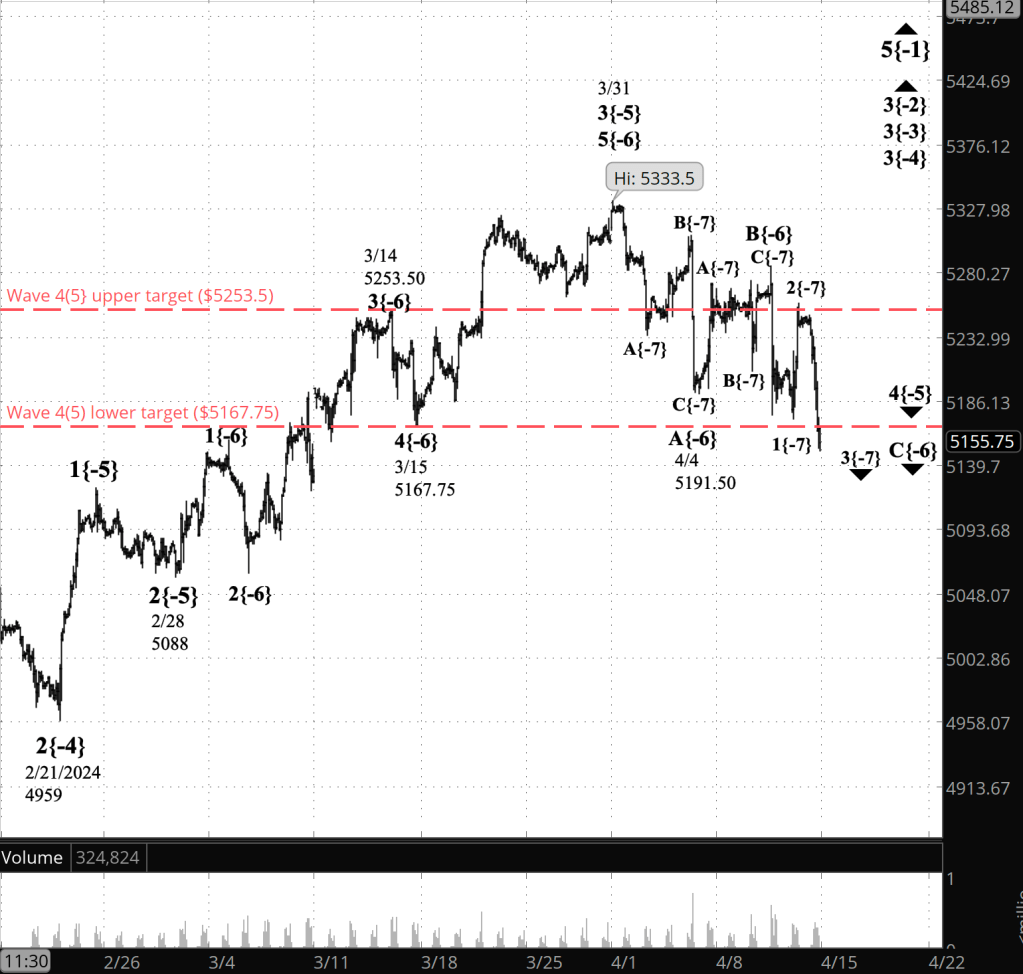
As the decline progressed, what I had marked as a low-degree declining B wave moved beyond the starting price of the preceding rising A wave.
And that’s not OK. Here’s why.
Under this morning’s analysis, wave A had five subwaves, which means that the larger 4th-wave downward correction that began on March 31 is taking the form of a ZigZag. The rule applying to Zigzags is that the B wave can never move beyond the starting point of the preceding wave.
Yet it did. My reanalysis has the initial subwave, wave A, of the 4th-wave downward correction ending on April 4, and wave B ending on April 10. The downward movement since then has been the C waver.
On the chart, the 4th-wave correction is 4{-5}, and the subwaves are waves A{-6}. B{-67} and C{-6}.
I’ve updated the chart with the new line-up.
9:35 a.m. New York time
What’s happening now? The S&P 500 E-mini futures fell overnight, from the 5240s to the 5190s
What does it mean? Elliott Wave Theory: The decline is the second subwave, wave B, within the first subwave, a rising wave B, of the 4th-wave downward correction that began on March 31. On the chart, the waves are labeled declining wave B{-7} within rising wave B{-6}, a subwave of wave 4{-5}, a downward correction. The subscripts, in curly brackets, tell each wave’s position within the fractal structure of the chart in terms of degrees distance from the Intermediate degree, represented since December 2018 by wave 5{0}.
On the chart, I’ve marked the wave B{-6} price target boundaries with blue dashed lines, and the wave 4{-5} price target boundaries with red dashed lines.
What are the alternatives? Wave A{-6} may still be underway. I marked it as having ended because of its proximity to the lower boundary of the 4th-wave price target range.
[S&P 500 E-mini futures at 9:40 a.m., 90-minute bars, with volume]
What does Elliott wave theory say? Here are the waves that underly the analyses.
Principal Analysis:
- Rising wave 5{0} is underway. It is a wave of Intermediate Degree that began in December 2018.
- It is in its final subwave, wave 5{-1}
- Within wave 5{-1}, rising waves 3{-2}, 3{-3} and 3{-4} are underway, as is the smallest wave labeled on the chart, wave 3{-5}.
- Downtrending wave 4{-5} is in its 2nd subwave, rising wave B{-6}.
Reading the chart. Price movements — waves – – in Elliott wave analysis are labeled with numbers within trending waves and letters with corrective waves. The subscripts — numbers in curly brackets — designate the wave’s degree, which, in Elliott wave analysis, means the relative position of a wave within the larger and smaller structures that make up the chart. R.N. Elliott, who in the 1930s developed the form of analysis that bears his name, viewed the chart as a complex structure of smaller waves nested within larger waves, which in turn are nested within still larger waves. In mathematics it’s called a fractal structure, where at every scale the pattern is similar to the others.
Learning and other resources. Elliott wave analysis provides context, not prophecy. As the 20th century semanticist Alfred Korzybski put it in his book Science and Sanity (1933), “The map is not the territory … The only usefulness of a map depends on similarity of structure between the empirical world and the map.” And I would add, in the ever-changing markets, we can judge that similarity of structure only after the fact.
See the menu page Analytical Methods for a rundown on where to go for information on Elliott wave analysis.
By Tim Bovee, Portland, Oregon, April 12, 2024
Disclaimer
Tim Bovee, Private Trader tracks the analysis and trades of a private trader for his own accounts. Nothing in this blog constitutes a recommendation to buy or sell stocks, options or any other financial instrument. The only purpose of this blog is to provide education and entertainment.
No trader is ever 100 percent successful in his or her trades. Trading in the stock and option markets is risky and uncertain. Each trader must make trading decisions for his or her own account, and take responsibility for the consequences.
License
All content on Tim Bovee, Private Trader by Timothy K. Bovee is licensed under a Creative Commons Attribution-ShareAlike 4.0 International License.
Based on a work at www.timbovee.com.

You must be logged in to post a comment.