3:30 p.m. New York time
Half an hour before the closing bell. The S&P 500 futures peaked at 5226.75 during the session and then fell swiftly back into the 5210s. Applying Elliott Wave Theory, the decline is the beginning of a 4th-wave downward correction within the 5th-wave uptrend that began on May 2.
I’ve updated the chart.
9:35 a.m. New York time
What’s happening now? The S&P 500 E-mini futures traded narrowly overnight, swinging between just above 5200 and the low 5210s.
What does it mean? In the terminology of Elliott Wave Theory, the pause is part of the 3rd subwave within the larger initial subwave of a 5th-wave uptrend that began on May 2.
The 5th wave is the final wave within a still larger 1st wave. When the present 5th wave is complete, it will mark the end of the 1st wave and the beginning of a 2nd wave downward correction.
This is all happening within a still larger 5th wave that began on April 18.
I’ve moved the chart closer in for a more detailed view of the 5th wave’s internal structure.
The waves on the chart are labeled with the wave number, followed by a subscript that shows the wave’s distance from the Intermediate degree, a large wave formation labeled wave 5{0}.
Deep within wave 5{0}, from smaller to larger, the present wave set is wave 3{-9} within wave 1{-8} within the 5th-wave uptrend, wave 5{-7}, within wave 1{-6}.
What are the alternatives? There is, however, an ambiguity. Are the waves labled in the chart as being of {-9} degree actually that small, or are they actually one degree higher in the fractal hierarchy, degree {-8}. If the {-9} designation is correction, then the 1st wave is still underway and the uptrend still has much further to go. If the {-8} designation is correct, then the uptrend is about halfway done.
My principal analysis best reflects the time it has taken waves of degree {-8} to reach completion, but the alternative analysis is not entirely far fetched, given the wide variation in how waves behave.
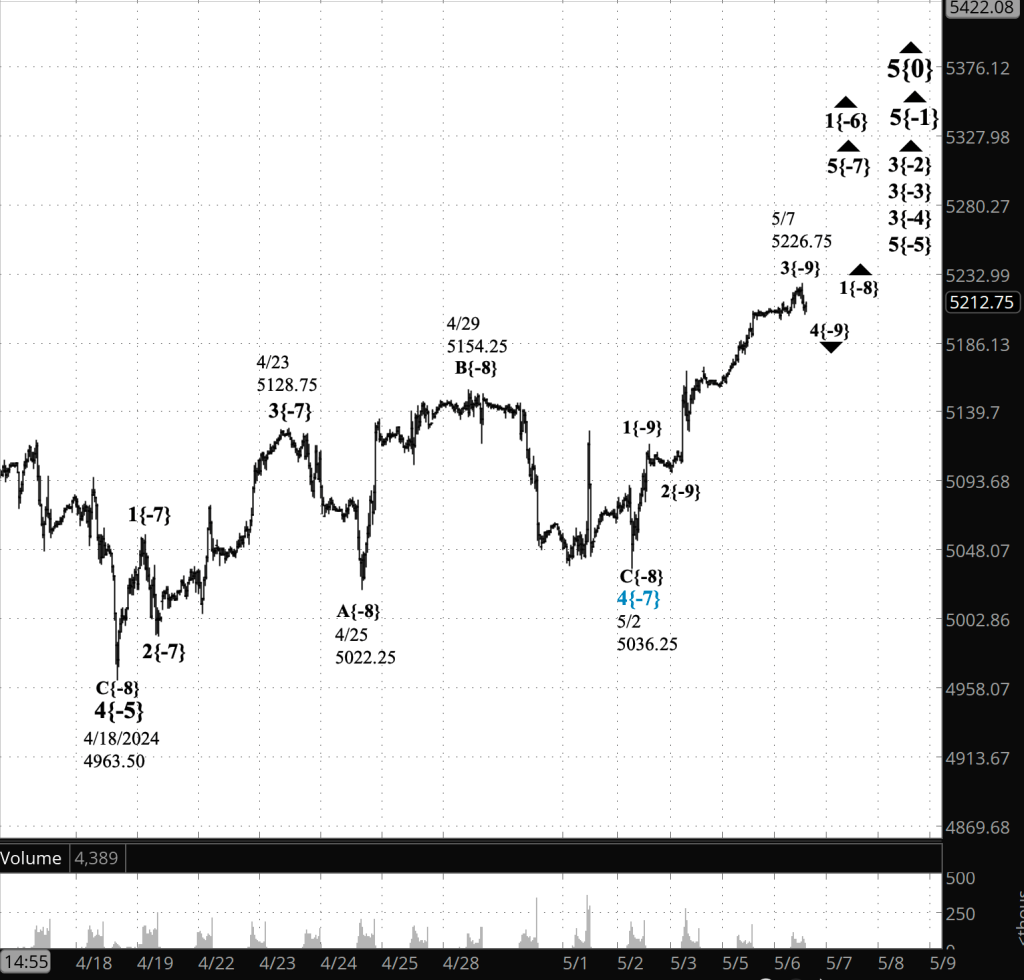
[S&P 500 E-mini futures at 3:30 p.m., 35-minute bars, with volume]
What does Elliott wave theory say? Here are the waves that underly the analyses.
Principal Analysis:
- Rising wave 5{0} is underway. It is a wave of Intermediate degree that began in December 2018.
- It is in its final subwave, wave 5{-1}.
- Within wave 5{-1}, rising waves 3{-2}, 3{-3} and 3{-4} are underway, as is wave 5{-5}.
- Wave 1{-6} is underway and is in its final subwave, wave 5{-7}, which is in its initial subwave, wave 1{-8}.
- Wave 1{-8} is in its middle subwave, wave 3{-9}.
Alternative Analysis:
- Wave 1{-6} is underway and is in its final subwave, wave 5{-7}, which is in its middle subwave, wave 3{-8}.
- Wave 3{-8} is in its middle subwave, wave 3{-9}
Reading the chart. Price movements — waves – – in Elliott wave analysis are labeled with numbers within trending waves and letters with corrective waves. The subscripts — numbers in curly brackets — designate the wave’s degree, which, in Elliott wave analysis, means the relative position of a wave within the larger and smaller structures that make up the chart. R.N. Elliott, who in the 1930s developed the form of analysis that bears his name, viewed the chart as a complex structure of smaller waves nested within larger waves, which in turn are nested within still larger waves. In mathematics it’s called a fractal structure, where at every scale the pattern is similar to the others.
Learning and other resources. Elliott wave analysis provides context, not prophecy. As the 20th century semanticist Alfred Korzybski put it in his book Science and Sanity (1933), “The map is not the territory … The only usefulness of a map depends on similarity of structure between the empirical world and the map.” And I would add, in the ever-changing markets, we can judge that similarity of structure only after the fact.
See the menu page Analytical Methods for a rundown on where to go for information on Elliott wave analysis.
By Tim Bovee, Portland, Oregon, May 7, 2024
Disclaimer
Tim Bovee, Private Trader tracks the analysis and trades of a private trader for his own accounts. Nothing in this blog constitutes a recommendation to buy or sell stocks, options or any other financial instrument. The only purpose of this blog is to provide education and entertainment.
No trader is ever 100 percent successful in his or her trades. Trading in the stock and option markets is risky and uncertain. Each trader must make trading decisions for his or her own account, and take responsibility for the consequences.
License
All content on Tim Bovee, Private Trader by Timothy K. Bovee is licensed under a Creative Commons Attribution-ShareAlike 4.0 International License.
Based on a work at www.timbovee.com.

You must be logged in to post a comment.