3:30 p.m. New York time
Half an hour before the closing bell. The S&P 500 futures swung up into the 5340s during the session and fell down into the 5320s, returning to the 5330s as the closing bell approached.
Were Shakespeare analyzing this session chart, he would pronounce it “full of sound and fury, signifying nothing.” Elliott Wave Theory, however, is far less skilled with words than the Bard, and pronounces the chart, “A continuation of the 4th-wave downward correction that began on May 16.”
I love Shakespeare for the beauty of his prose, but spend more time with Elliott Wave Theory for the clarity of its conclusions.
The session high, 5348.75, is likely the end of the second of three waves within the correction, the B wave, and the declining wave that followed is the final wave in the correction, a C wave. The B wave has three subwaves, so unless there’s a reversal above that peak, the B wave is history.
A 5th-wave uptrend of low degree will follow the C wave.
I’ve updated the chart.
9:35 a.m. New York time
What’s happening now? The S&P 500 E-mini futures traded narrowly after trading resumed overnight, rising into the 5330s in the first 5 minutes and staying within that range thereafter.
What does it mean? Elliott Wave Theory sees the overnight pattern as a continuation of the 4th-wave downward correction of low degree that began on May 16. The correction is part of a larger, although still low degree, 5th-wave uptrend that began on May 14.
From that point, as we climb the fractal structure of the chart, we encounter a nested series of uptrending waves that are underway: A 5th-wave uptrend that began on May 8; 3rd wave, May 2; 1st-wave, April 18th wave; 5th wave, April 18.
Each 5th wave, when complete, will signal the end of its parent wave. Each 3rd or 1st wave, when complete, will be followed by a downward correction.
The nested series of waves listed above will be followed by a series of nested 3rd waves of increasing size, covering 4 degrees.
All of this is happening within a 5th-wave uptrend that began on October 13, 2022 from 3502.
For my daily trading I follow the waves of lower degree. However, it’s important to remember that the waves of higher degree have the ability to upset the economy and indeed the wellbeing the nation.
When the 5th-wave uptrend that began on October 13, 2022 is complete, it will trigger the end of a nested series of 5th waves that began on March 6 2009, December 9, 1974 and July 8, 1932.
The downtrend that follows will be an event for the history books.
What are the alternatives? Returning to the more recent waves of low degree, the four smallest waves on the chart — labeled 4{-10}, 5{-9}, 5{-8} and 3{-7} — may in fact be one degree larger, eliminating the next higher degree, wave 1{-6}. See the Reading the Chart section below for an explanation of wave labeling, including the curly brackets.
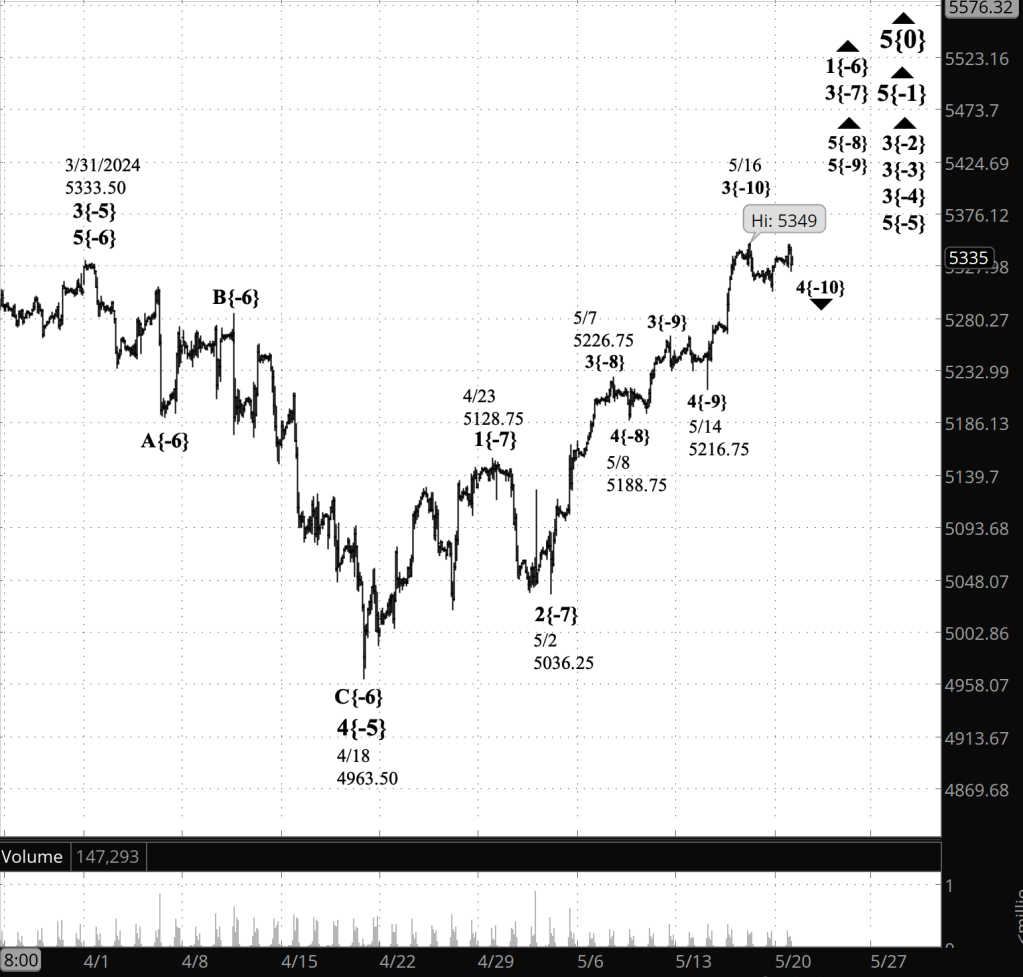
[S&P 500 E-mini futures at 3:30 p.m., 100-minute bars, with volume]
What does Elliott wave theory say? Here are the waves that underly the analyses.
Principal Analysis:
- Rising wave 5{0} is underway. It is a wave of Intermediate degree that began in December 2018.
- It is in its final subwave, wave 5{-1}.
- Within wave 5{-1}, rising waves 3{-2}, 3{-3} and 3{-4} are underway, as is wave 5{-5}.
- Wave 1{-6} is underway and is in its middle subwave, wave 3{-7}, which is in its final subwave, wave 5{-8}.
- Wave 5{-8} is in its final subwave, wave 5{-9}, which is in its next-to-the-last subwave, wave 4{-10}.
Big Picture.
These are the higher-degree waves currently in progress under my principal analysis. Each line on the list shows the wave number, with the subscript in curly brackets, the traditional degree name, the starting date, the starting price of the S&P 500 E-mini futures, and the direction of the wave.
- S&P 500 Index:
- 5{+3} Supercycle, 7/8/1932, 4.40 (up)
- 5{+2} Cycle, 12/9/1974, 60.96 (up)
- 5{+1} Primary, 3/6/2009, 666.79 (up)
- 5{0} Intermediate, 12/26/2018, 2346.58 (up)
- S&P 500 Futures and Index:
- 5{-1} Minor, 10/13/2022, 3502 (up) (futures), 3491.58 (up) (index)
Reading the chart. Price movements — waves – – in Elliott wave analysis are labeled with numbers within trending waves and letters with corrective waves. The subscripts — numbers in curly brackets — designate the wave’s degree, which, in Elliott wave analysis, means the relative position of a wave within the larger and smaller structures that make up the chart. R.N. Elliott, who in the 1930s developed the form of analysis that bears his name, viewed the chart as a complex structure of smaller waves nested within larger waves, which in turn are nested within still larger waves. In mathematics it’s called a fractal structure, where at every scale the pattern is similar to the others.
Learning and other resources. Elliott wave analysis provides context, not prophecy. As the 20th century semanticist Alfred Korzybski put it in his book Science and Sanity (1933), “The map is not the territory … The only usefulness of a map depends on similarity of structure between the empirical world and the map.” And I would add, in the ever-changing markets, we can judge that similarity of structure only after the fact.
See the menu page Analytical Methods for a rundown on where to go for information on Elliott wave analysis.
By Tim Bovee, Portland, Oregon, May 20, 2024
Disclaimer
Tim Bovee, Private Trader tracks the analysis and trades of a private trader for his own accounts. Nothing in this blog constitutes a recommendation to buy or sell stocks, options or any other financial instrument. The only purpose of this blog is to provide education and entertainment.
No trader is ever 100 percent successful in his or her trades. Trading in the stock and option markets is risky and uncertain. Each trader must make trading decisions for his or her own account, and take responsibility for the consequences.
License
All content on Tim Bovee, Private Trader by Timothy K. Bovee is licensed under a Creative Commons Attribution-ShareAlike 4.0 International License.
Based on a work at www.timbovee.com.

You must be logged in to post a comment.