3:30 p.m. New York time
Half an hour before the closing bell. Elliott Wave Theory says: The S&P 500 futures continued to work their way through a 4th-wave downward correction of low degree. So far it has retraced 41% of the preceding 3rd wave. A 4th wave typically ends within the 4th subwave of the preceding 3rd wave. This small correction has moved bellow that level.
I focus on the correction because of what comes next: A rising 5th wave that will complete the smaller correction, which began on May 16, also that larger rising 5th wave that began on May 8, and the still larger 3rd wave that began on May 2, which will be followed by a larger downward correction.
I’ve updated the chart.
9:35 a.m. New York time
What’s happening now? The S&P 500 E-mini futures dropped back into the 5320s overnight.
What does it mean? Elliott Wave Theory reads the decline as a continuation of the 4th-wave downward correction of low degree that began on May 16. In other words, nothing in the analysis has really changed since yesterday.
Although the correction is small, two degrees below Minuscule degree in the traditional nomenclature, the fractal structure of the market’s price movements gives it significance far greater than its size.
Looking ahead, the end of the 4th-wave correction will also be the beginning of a 5th-wave uptrend. When the 5th wave is complete, it will also be completion of two nested 5th waves, each one degree higher in the fractal structure, the uptrending waves that began on May 14 and May 8. It will also mark the end of a 3rd-degree uptrend one degree higher, which began on May 2.
And so it goes. The English poet John Donne, in the beginning lines of a poem published in 1624, said it best: “No man is an island / entire of itself; / Every man is a piece of the continent, / A part of the main.”
In Elliott Wave Theory’s fractal structure, no wave stands alone.
What are the alternatives? Also unchanged. The four smallest waves on the chart — labeled 4{-10}, 5{-9}, 5{-8} and 3{-7} — may in fact be one degree larger, eliminating the next higher degree, wave 1{-6}. See the Reading the Chart section below for an explanation of wave labeling, including the curly brackets.
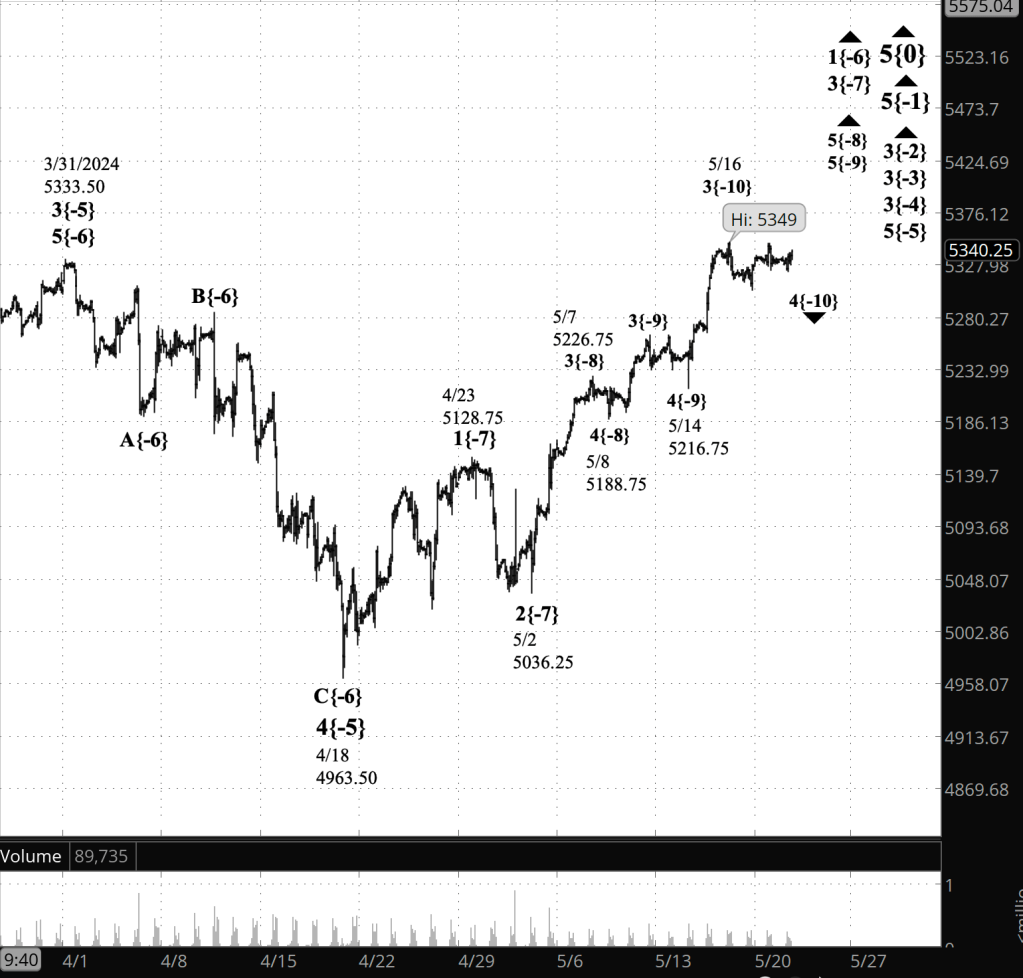
[S&P 500 E-mini futures at 3:30 p.m., 100-minute bars, with volume]
What does Elliott wave theory say? Here are the waves that underly the analyses.
Principal Analysis:
- Rising wave 5{0} is underway. It is a wave of Intermediate degree that began in December 2018.
- It is in its final subwave, wave 5{-1}.
- Within wave 5{-1}, rising waves 3{-2}, 3{-3} and 3{-4} are underway, as is wave 5{-5}.
- Wave 1{-6} is underway and is in its middle subwave, wave 3{-7}, which is in its final subwave, wave 5{-8}.
- Wave 5{-8} is in its final subwave, wave 5{-9}, which is in its next-to-the-last subwave, wave 4{-10}.
Reading the chart. Price movements — waves – – in Elliott wave analysis are labeled with numbers within trending waves and letters with corrective waves. The subscripts — numbers in curly brackets — designate the wave’s degree, which, in Elliott wave analysis, means the relative position of a wave within the larger and smaller structures that make up the chart. R.N. Elliott, who in the 1930s developed the form of analysis that bears his name, viewed the chart as a complex structure of smaller waves nested within larger waves, which in turn are nested within still larger waves. In mathematics it’s called a fractal structure, where at every scale the pattern is similar to the others.
Learning and other resources. Elliott wave analysis provides context, not prophecy. As the 20th century semanticist Alfred Korzybski put it in his book Science and Sanity (1933), “The map is not the territory … The only usefulness of a map depends on similarity of structure between the empirical world and the map.” And I would add, in the ever-changing markets, we can judge that similarity of structure only after the fact.
See the menu page Analytical Methods for a rundown on where to go for information on Elliott wave analysis.
By Tim Bovee, Portland, Oregon, May 21, 2024
Disclaimer
Tim Bovee, Private Trader tracks the analysis and trades of a private trader for his own accounts. Nothing in this blog constitutes a recommendation to buy or sell stocks, options or any other financial instrument. The only purpose of this blog is to provide education and entertainment.
No trader is ever 100 percent successful in his or her trades. Trading in the stock and option markets is risky and uncertain. Each trader must make trading decisions for his or her own account, and take responsibility for the consequences.
License
All content on Tim Bovee, Private Trader by Timothy K. Bovee is licensed under a Creative Commons Attribution-ShareAlike 4.0 International License.
Based on a work at www.timbovee.com.

You must be logged in to post a comment.