3:30 p.m. New York time
Half an hour before the closing bell. The S&P 500 futures turned sharply downward during the session, moving rapidly from the overnight peak in the 5360s into the 5270s.
The decline invalidated this morning’s principal analysis. The 4th-wave downward correction that began on May 16 continues and is in its final subwave, wave C. When wave C is complete, it will also be the end of wave 4 and the beginning of a 5th-wave uptrend. But not yet.
I’ve updated the chart.
9:35 a.m. New York time
[Note that events on the chart have invalidated the analysis that follows.]
What’s happening now? The S&P 500 E-mini futures rose overnight, reaching into the 5360s.
What does it mean? Elliott Wave Theory sees the move to a new high as the first steps in a 5th-wave uptrend of low degree. The uptrend began on May 22 from 5306.75.
The preceding small 3rd-wave uptrend, usually the longest wave within a trend, took two days to complete. However, 5th waves tend to be on the quirky side. Sometimes they come up short, and sometimes they extend, moving beyond expectations.
This wave 5 has already moved beyond the end of the preceding 3rd wave and so by definition hasn’t come up short. It’s now in the as-expected territory.
The preceding 3rd wave rose 82.75 points. There’s no rule in Elliott Wave Theory that requires the 5th wave to be shorter or longer. If it covers a similar distance, it will reach into the 5380s.
In any case, wave 5 will have five subwaves. When complete, it will will also mark the end of two larger 5th waves in the fractal structure of the chart, and a still larger 3rd wave that began on May 7.
Waves are labeled on the chart with the wave number followed by a subscript, in curly brackets, that sow the wave’s distance from Intermediate degree in the fractal structure of the chart. The present Intermediate degree began in December 2018.
Here are the wave’s discussed above: Wave 4{-10} ended, wave 5{-10} has began, it has moved beyond the end of wave 3{-10}. When wave 5{-10} is complete, it will also mark the end of waves 5{-9} and 5{-9}, and also of their parent wave, 3{-8}. A downward correction, wave 4{-8}, will begin.
What are the alternatives? An ambiguity on the chart, regarding the 1st wave that began on April 18. The four smaller waves on the chart below wave 1 — labeled 4{-10}, 5{-9}, 5{-8} and 3{-7} — may in fact be one degree larger, eliminating the next higher degree, wave 1{-6}. See the Reading the Chart section below for an explanation of wave labeling, including the curly brackets.
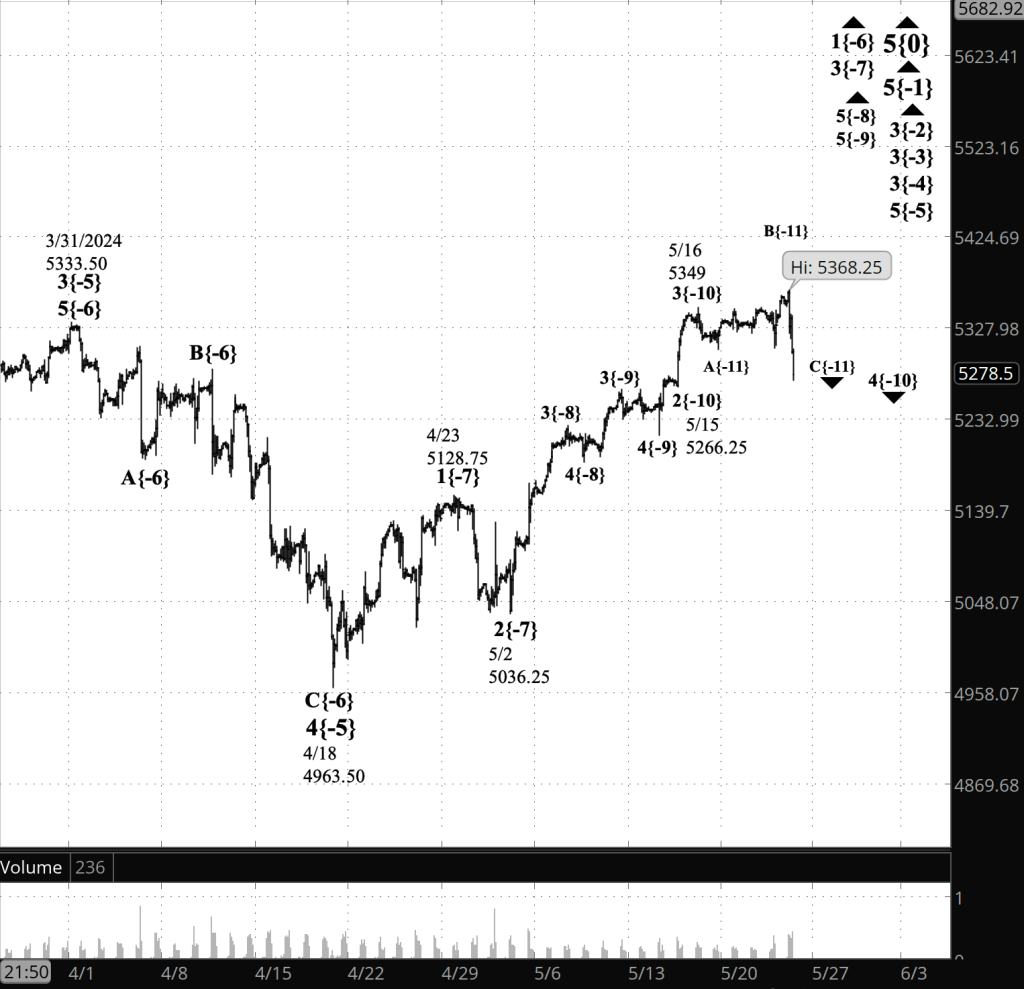
[S&P 500 E-mini futures at 3:30 p.m., 110-minute bars, with volume]
Note that the above chart contains a major revidsion from this morning’s version]
What does Elliott wave theory say? Here are the waves that underly the analyses.
[Revised to account for events on the chart during the session]
Principal Analysis:
- Rising wave 5{0} is underway. It is a wave of Intermediate degree that began in December 2018.
- It is in its final subwave, wave 5{-1}.
- Within wave 5{-1}, rising waves 3{-2}, 3{-3} and 3{-4} are underway, as is wave 5{-5}.
- Wave 1{-6} is underway and is in its middle subwave, wave 3{-7}, which is in its final subwave, wave 5{-8}.
- Wave 5{-8} is in its final subwave, wave 5{-9}, which is in its next-to-the-last subwave, wave 4{-10}.
We Are Here.
These are the waves currently in progress under my principal analysis. Each line on the list shows the wave number, with the subscript in curly brackets, the traditional degree name, the starting date, the starting price of the S&P 500 E-mini futures, and the direction of the wave.
- S&P 500 Index:
- 5{+3} Supercycle, 7/8/1932, 4.40 (up)
- 5{+2} Cycle, 12/9/1974, 60.96 (up)
- 5{+1} Primary, 3/6/2009, 666.79 (up)
- 5{0} Intermediate, 12/26/2018, 2346.58 (up)
- S&P 500 Futures and index:
- 5{-1} Minor, 10/13/2022, 3502 (up) (futures), 3491.58 (up) (index)
- S&P 500 Futures:
Reading the chart. Price movements — waves – – in Elliott wave analysis are labeled with numbers within trending waves and letters with corrective waves. The subscripts — numbers in curly brackets — designate the wave’s degree, which, in Elliott wave analysis, means the relative position of a wave within the larger and smaller structures that make up the chart. R.N. Elliott, who in the 1930s developed the form of analysis that bears his name, viewed the chart as a complex structure of smaller waves nested within larger waves, which in turn are nested within still larger waves. In mathematics it’s called a fractal structure, where at every scale the pattern is similar to the others.
Learning and other resources. Elliott wave analysis provides context, not prophecy. As the 20th century semanticist Alfred Korzybski put it in his book Science and Sanity (1933), “The map is not the territory … The only usefulness of a map depends on similarity of structure between the empirical world and the map.” And I would add, in the ever-changing markets, we can judge that similarity of structure only after the fact.
See the menu page Analytical Methods for a rundown on where to go for information on Elliott wave analysis.
By Tim Bovee, Portland, Oregon, May 23, 2024
Disclaimer
Tim Bovee, Private Trader tracks the analysis and trades of a private trader for his own accounts. Nothing in this blog constitutes a recommendation to buy or sell stocks, options or any other financial instrument. The only purpose of this blog is to provide education and entertainment.
No trader is ever 100 percent successful in his or her trades. Trading in the stock and option markets is risky and uncertain. Each trader must make trading decisions for his or her own account, and take responsibility for the consequences.
License
All content on Tim Bovee, Private Trader by Timothy K. Bovee is licensed under a Creative Commons Attribution-ShareAlike 4.0 International License.
Based on a work at www.timbovee.com.

You must be logged in to post a comment.