Market Holiday. U.S. markets will be closed on Monday in observance of the Memorial Day holiday, which honors American military who died for their country. Trading of the S&P 500 futures will resume Monday night and the regular sessions will resume on Tuesday, May 28.
3:30 p.m. New York time
Half an hour before the closing bell. The S&P 500 futures climbed further, into the 5320s, and then dropped back slightly into the 5310s so far. Elliott Wave Theory: The session rise was the 4th subwave with wave C, the final subwave of the 4th-wave downward correction that began on May 16. The decline that followed is most likely the beginning of the 5th and final subwave within wave C. The 4th subwave of C is expected to have three subwaves, and that’s what shows on the chart. However, I’d like to see further decline to verify that wave C’s 5th subwave is underway.
I’ve updated the chart.
9:35 a.m. New York time
What’s happening now? The S&P 500 E-mini futures rose gently overnight, from the 5280s to above 5300.
What does it mean? Elliott Wave Theory sees the rise as part of the final subwave — wave C — of a 4th-wave downward correction that began on May 16. The C wave in a three-subwave correct has five subwaves, two degrees deep within the correction. The overnight rise is wave C’s 4th subwave.
A falling 5th subwave will follow, bringing wave C to a close and also ending the 4th-wave downward correction. A 5th-wave uptrend will follow. When it is complete, it will also be the end of two 5th waves, each larger than the one before, and a still larger 3rd wave that began on May 2.
What are the alternatives? All of that is happening within a still larger 1st wave that began on April 18. Maybe. It’s also possible that there is no still larger 1st wave, and instead, that the four smaller waves on the chart below wave 1 — labeled 4{-10}, 5{-9}, 5{-8} and 3{-7} — are one degree larger, eliminating the next higher degree. In that case, wave 1{-6} ended on April 23. See the Reading the Chart section below for an explanation of wave labeling, including the curly brackets.
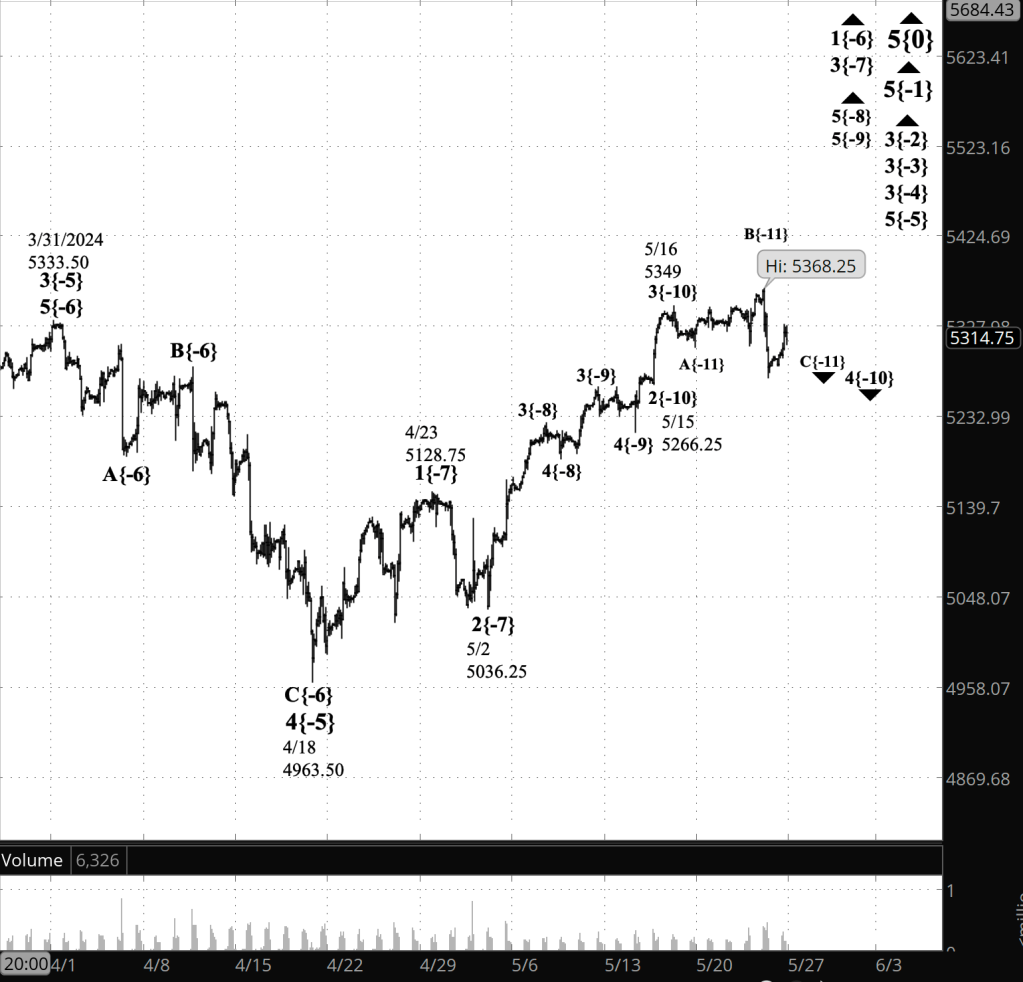
[S&P 500 E-mini futures at 3:30 p.m., 110-minute bars, with volume]
What does Elliott wave theory say? Here are the waves that underly the analyses.
Principal Analysis:
- Rising wave 5{0} is underway. It is a wave of Intermediate degree that began in December 2018.
- It is in its final subwave, wave 5{-1}.
- Within wave 5{-1}, rising waves 3{-2}, 3{-3} and 3{-4} are underway, as is wave 5{-5}.
- Wave 1{-6} is underway and is in its middle subwave, wave 3{-7}, which is in its final subwave, wave 5{-8}.
- Wave 5{-8} is in its final subwave, wave 5{-9}, which is in its next-to-the-last subwave, wave 4{-10}.
- Within wave 4{-10}, the final subwave, wave C{-11}, is underway and likely is in its final subwave, wave 5{-12}.
Bigger Waves.
Of course, the fractal structure of the market isn’t limited to the smaller waves listed above. They are subwaves within a set of much bigger waves power enough to be rightly considered engines of history. Each line on the list shows the wave number, with the subscript in curly brackets, the traditional degree name, the starting date, the starting price of the S&P 500 E-mini futures, and the direction of the wave.
- S&P 500 Index:
- 5{+3} Supercycle, 7/8/1932, 4.40 (up)
- 5{+2} Cycle, 12/9/1974, 60.96 (up)
- 5{+1} Primary, 3/6/2009, 666.79 (up)
- 5{0} Intermediate, 12/26/2018, 2346.58 (up)
- S&P 500 Futures and index:
- 5{-1} Minor, 10/13/2022, 3502 (up) (futures), 3491.58 (up) (index)
Reading the chart. Price movements — waves – – in Elliott wave analysis are labeled with numbers within trending waves and letters with corrective waves. The subscripts — numbers in curly brackets — designate the wave’s degree, which, in Elliott wave analysis, means the relative position of a wave within the larger and smaller structures that make up the chart. R.N. Elliott, who in the 1930s developed the form of analysis that bears his name, viewed the chart as a complex structure of smaller waves nested within larger waves, which in turn are nested within still larger waves. In mathematics it’s called a fractal structure, where at every scale the pattern is similar to the others.
Learning and other resources. Elliott wave analysis provides context, not prophecy. As the 20th century semanticist Alfred Korzybski put it in his book Science and Sanity (1933), “The map is not the territory … The only usefulness of a map depends on similarity of structure between the empirical world and the map.” And I would add, in the ever-changing markets, we can judge that similarity of structure only after the fact.
See the menu page Analytical Methods for a rundown on where to go for information on Elliott wave analysis.
By Tim Bovee, Portland, Oregon, May 24, 2024
Disclaimer
Tim Bovee, Private Trader tracks the analysis and trades of a private trader for his own accounts. Nothing in this blog constitutes a recommendation to buy or sell stocks, options or any other financial instrument. The only purpose of this blog is to provide education and entertainment.
No trader is ever 100 percent successful in his or her trades. Trading in the stock and option markets is risky and uncertain. Each trader must make trading decisions for his or her own account, and take responsibility for the consequences.
License
All content on Tim Bovee, Private Trader by Timothy K. Bovee is licensed under a Creative Commons Attribution-ShareAlike 4.0 International License.
Based on a work at www.timbovee.com.

You must be logged in to post a comment.