3:30 p.m. New York time
Half an hour before the closing bell. The S&P 500 futures has fluctuated between the 5250s and the 5270s during the session so far. Elliott Wave Theory: The C wave within the 4th-wave downward correction continues, with the analysis unchanged from this morning.
I’ve updated the chart.
9:35 a.m. New York time
What’s happening now? The S&P 500 E-mini futures fell overnight, from the 5270s to the 5250s, and then began to rise, returning to the 5270s in a rapid spike that coincided with the release of the second estimate of the Gross Deomestic Product for the initial three months of the year.
Elliott Wave Theory. The decline is part of the final subwave within the 4th-wave downward correction that began on on May 16. That subwave is wave C of the correction.
The C wave takes the form of what Elliott Wave Theory calls an impulse wave, five waves alternating in direction. Wave C is presently in its third subwave, often the longest of the five. Since its the C wave within a downward correction, both the C wave and the 3rd subwave will be trending lower.
What’s next? The 3rd subwave within wave C will be followed by a smaller 4th-wave upward correction and then a wave 5, a final push to the downside. Fifth waves tend to have a lot of variety. Sometimes they fail to make it beyond the end of the preceding 3rd wave. Sometimes they take on an extended form, moving far beyond where the wave 3 terminated. Sometimes they reach completion at the wave 3 end point.
The bigger picture. Although the 5th subwave within wave C is a small wave, it’s completion will have an outsized impact. Price movements on the chart have a fractal structure. Smaller waves are subwaves of larger waves which in turn are subwaves of still larger waves. And no matter how large or small, all of the waves create the same patterns: Impulse waves with five subwaves and corrective waves with three subwaves, with the occasional oddball triangle pattern that is seen less often. A wave’s position within the fractal structure is called its “degree”.
So the end of wave 5, a wave of small degree, will also be the end of wave C, one degree higher, and wave 4, two degrees higher, and wave 3, yet another degree higher. Wave 3 in this structure began on May 7, and when complete, it will be followed by a 4th-wave downward correction that is three degrees higher than the present 4th-wave that began on May 16 and that is nearing its end.
Encompassing all of this wave a 1st wave that began on April 18, according to my principal analysis. And there in lies an ambiguity.
What are the alternatives? I labeled the rise from April 18 as wave because its size seemed to match waves of similar degree that had come before. Like most attempts at pattern-recognition, there’s a subjective of element that means that the pattern may not be what it seems.
What if the degrees I’ve labeled as being subwaves of wave 1, stretching down six degrees, are really one degree higher? What if instead, the four smaller waves on the chart below wave 1 — labeled 4{-10}, 5{-9}, 5{-8} and 3{-7} — are one degree larger, eliminating the next higher degree. In that case, wave 1{-6} ended on April 23. See the Reading the Chart section below for an explanation of wave labeling, including the curly brackets.
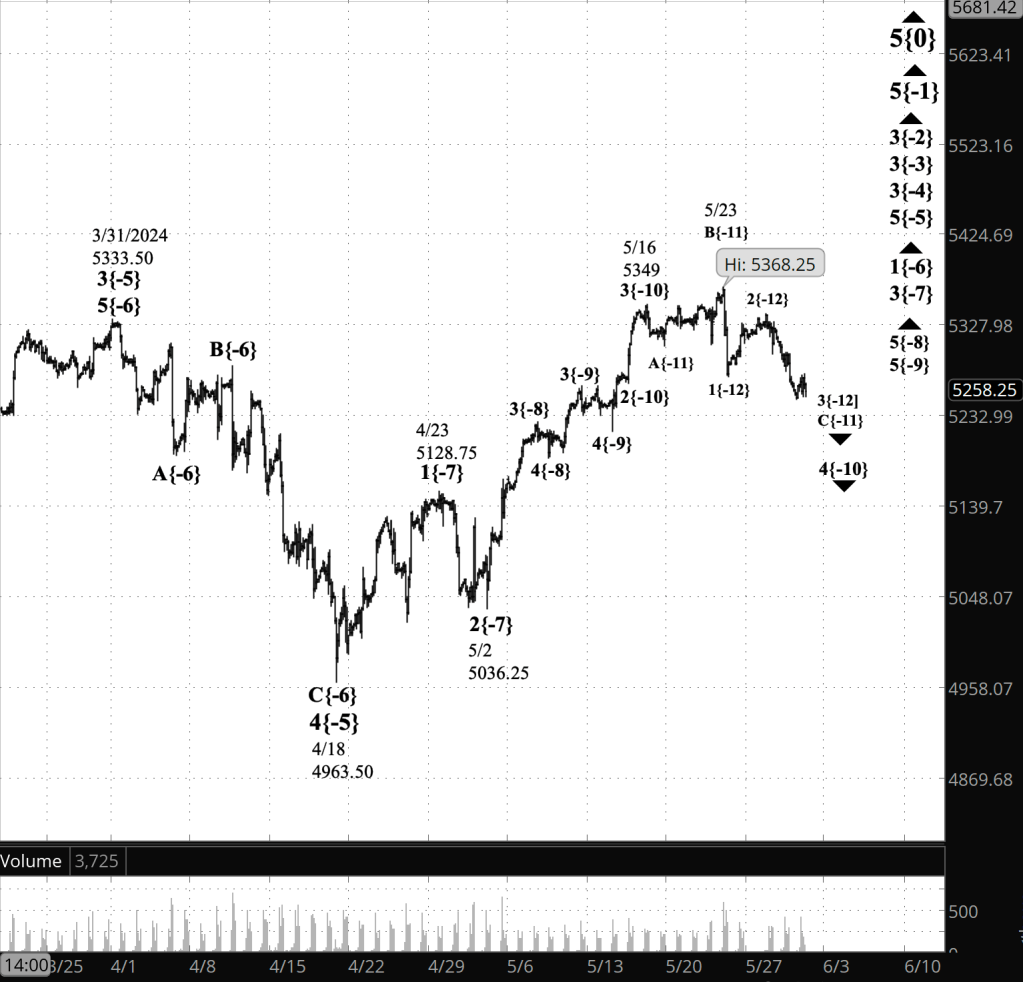
[S&P 500 E-mini futures at 3:30 p.m., 2-hour bars, with volume]
What does Elliott wave theory say? Here are the waves that underly the analyses.
Principal Analysis:
- Rising wave 5{0} is underway. It is a wave of Intermediate degree that began in December 2018.
- It is in its final subwave, wave 5{-1}.
- Within wave 5{-1}, rising waves 3{-2}, 3{-3} and 3{-4} are underway, as is wave 5{-5}.
- Wave 1{-6} is underway and is in its middle subwave, wave 3{-7}, which is in its final subwave, wave 5{-8}.
- Wave 5{-8} is in its final subwave, wave 5{-9}, which is in its next-to-the-last subwave, wave 4{-10}.
- Within wave 4{-10}, the final subwave, wave C{-11}, is underway and is in its middle subwave, wave 3{-12}.
Reading the chart. Price movements — waves – – in Elliott wave analysis are labeled with numbers within trending waves and letters with corrective waves. The subscripts — numbers in curly brackets — designate the wave’s degree, which, in Elliott wave analysis, means the relative position of a wave within the larger and smaller structures that make up the chart. R.N. Elliott, who in the 1930s developed the form of analysis that bears his name, viewed the chart as a complex structure of smaller waves nested within larger waves, which in turn are nested within still larger waves. In mathematics it’s called a fractal structure, where at every scale the pattern is similar to the others.
Learning and other resources. Elliott wave analysis provides context, not prophecy. As the 20th century semanticist Alfred Korzybski put it in his book Science and Sanity (1933), “The map is not the territory … The only usefulness of a map depends on similarity of structure between the empirical world and the map.” And I would add, in the ever-changing markets, we can judge that similarity of structure only after the fact.
See the menu page Analytical Methods for a rundown on where to go for information on Elliott wave analysis.
By Tim Bovee, Portland, Oregon, May 30, 2024
Disclaimer
Tim Bovee, Private Trader tracks the analysis and trades of a private trader for his own accounts. Nothing in this blog constitutes a recommendation to buy or sell stocks, options or any other financial instrument. The only purpose of this blog is to provide education and entertainment.
No trader is ever 100 percent successful in his or her trades. Trading in the stock and option markets is risky and uncertain. Each trader must make trading decisions for his or her own account, and take responsibility for the consequences.
License
All content on Tim Bovee, Private Trader by Timothy K. Bovee is licensed under a Creative Commons Attribution-ShareAlike 4.0 International License.
Based on a work at www.timbovee.com.

You must be logged in to post a comment.