3:30 p.m. New York time
Half an hour before the closing bell. The S&P 500 futures has reached 5413.25 during and then reversed to the downside. The movement, in Elliott Wave Theory, is part of the final subwave, wave C, of the 4th-wave downward correction that began on May 16. Wave C will have five subwaves. The rise that began on May 31 and ended today is the first subwave, wave A, within the larger rising 4th wave that began on May 31. Today’s subsequent decline is a declining B wave within the rising 4th wave.
A rising C wave will complete the small 4th wave upward correction that started on May 31, ending the larger 4th-wave downward correction and beginning an uptrending 5th wave.
These are all small fluctuations in the general scheme of things. See this morning’s “What happens next” section, below, for a discussion of the larger implications.
9:35 a.m. New York time
What’s happening now? The S&P 500 E-mini futures stayed in a narrow sideways path after tradng resumed overnight, fluctuating from the 5290s to the 5310s.
What does it mean? The price rose sharply during the May 31 session, covering a bit more than 100 points. Elliott Wave Theory sees the rise as as a low-degree part of the 4th-wave downward correction that has been underway since May 16. The downward correction is in its declining C wave, the final subwave of the structure, and Friday’s rise is the 4th subwave of five within the C wave.
What happens next? The 4th subwave within wave C will be followed by a declining wave 5 which, when complete, will also be the end of wave C and the 4th-wave downward correction. An uptrending 5th-wave will follow and will, when complete, cascade up the fractal structure, putting an end to 5th waves one and two degrees larger, and a still larger 3rd wave. The 3rd wave began on May 7. A downtrending 4th wave will follow, three degrees larger than the one now underway.
What happened to the 1st wave? For weeks there has been an ambiguity one degree above the 3rd wave that began on May 7. Under my principal analysis, I had labeled that wave as the 1st subwave within a still larger 5th-wave uptrend, both of which began on April 18. But was there really a 1st wave, or are all of the subwaves I’ve placed within wave 1 actually one degree higher?
There is no 1st wave now underway, as it turns out. The 1st wave in question ended on April 19. I’ve made that scenario the new principal correvtion.
Waves on the chart are labeled with a wave number followed a subscript showing wave’s degree relative to what Elliott Wave Theory calls the Intermediate degree. The present Intermediate degree, wave 5{0}, began in December 20189.
The present 1st wave has grown out of proportion to prior 1st waves of similar degree, and I’ve eliminated it from the principal analysis. With no wave 1 underway, then the waves on the chart that had been labeled as labeled 4{-12}, C{-11}, 4{-10}, 5{-9}, 5{-8} and 3{-7} ought to be labeled 4{-11}, C{-10}, 4{-9}, 5{-8}, 5{-7} and 3{-6}.
Is there an alternative analysis? With the disappearance of an ongoing wave 1 from the analysis, there is no alternative at present. Alternatives will surely develop, as they tend to do in Elliott Wave Theory.
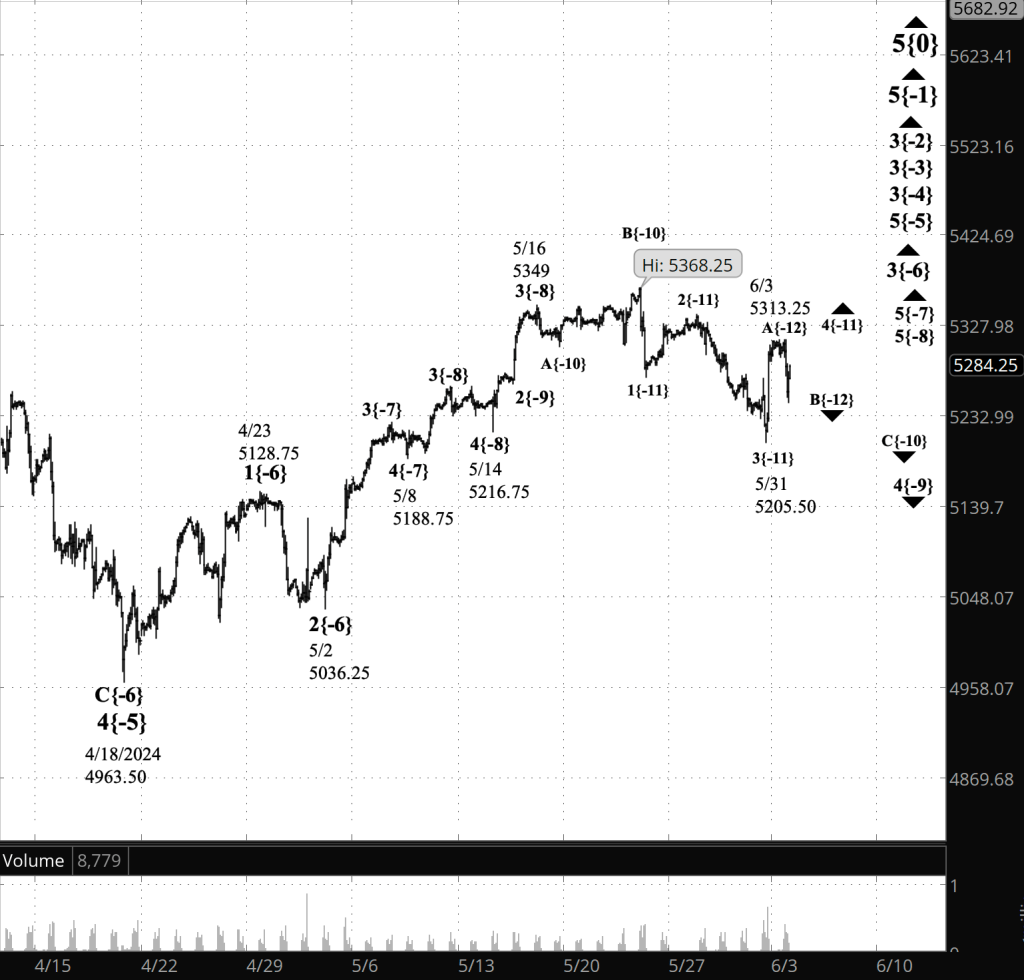
[S&P 500 E-mini futures at 3:30 p.m., 90-minute bars, with volume]
What does Elliott wave theory say? Here are the waves that underly the analyses.
Principal Analysis:
- Rising wave 5{0} is underway. It is a wave of Intermediate degree that began in December 2018.
- It is in its final subwave, wave 5{-1}.
- Within wave 5{-1}, rising waves 3{-2}, 3{-3} and 3{-4} are underway, as is wave 5{-5}.
- Wave 3{-6} is underway and is in its middle subwave, wave 5{-7}, which is in its final subwave, wave 5{-8}.
- Wave 5{-8} is in its next-to-the-last subwave, wave 4{-9}, a downward correction.
- Within wave 4{-9}, the final subwave, wave C{-10}, is underway and is in its nect-to-the-last subwave, wave 4{-11}.
Reading the chart. Price movements — waves – – in Elliott wave analysis are labeled with numbers within trending waves and letters with corrective waves. The subscripts — numbers in curly brackets — designate the wave’s degree, which, in Elliott wave analysis, means the relative position of a wave within the larger and smaller structures that make up the chart. R.N. Elliott, who in the 1930s developed the form of analysis that bears his name, viewed the chart as a complex structure of smaller waves nested within larger waves, which in turn are nested within still larger waves. In mathematics it’s called a fractal structure, where at every scale the pattern is similar to the others.
Learning and other resources. Elliott wave analysis provides context, not prophecy. As the 20th century semanticist Alfred Korzybski put it in his book Science and Sanity (1933), “The map is not the territory … The only usefulness of a map depends on similarity of structure between the empirical world and the map.” And I would add, in the ever-changing markets, we can judge that similarity of structure only after the fact.
See the menu page Analytical Methods for a rundown on where to go for information on Elliott wave analysis.
By Tim Bovee, Portland, Oregon, June 3, 2024
Disclaimer
Tim Bovee, Private Trader tracks the analysis and trades of a private trader for his own accounts. Nothing in this blog constitutes a recommendation to buy or sell stocks, options or any other financial instrument. The only purpose of this blog is to provide education and entertainment.
No trader is ever 100 percent successful in his or her trades. Trading in the stock and option markets is risky and uncertain. Each trader must make trading decisions for his or her own account, and take responsibility for the consequences.
License
All content on Tim Bovee, Private Trader by Timothy K. Bovee is licensed under a Creative Commons Attribution-ShareAlike 4.0 International License.
Based on a work at www.timbovee.com.

You must be logged in to post a comment.