3:30 p.m. New York time
Half an hour before the closing bell. The S&P 500 futures dropped slightly during the session, barely budging when the Federal Open Market Committee announced it was holding interest rates steady.
Applying Elliott Wave Theory: The decline is a downward correction of low degree within the uptrending 5th wave that began on June 11.
I’ve updated the chart.
9:35 a.m. New York time
What’s happening now? The S&P 500 E-mini futures rose sharply as the opening bell approached after new inflation data showed no change in prices overall in May compared to the prior month. The Federal Open Market Committee will announce its decision on interest rates during the session, at 2 p.m. New York time.
What does it mean? In Elliott Wave Theory, the rise confirms that the small 4th-wave downward correction that began on June 7 ended on July 11 at 5334.50 and a 5th-wave uptrend, also of a low degree, began on that date.
Fifth waves are the wayward children within a trend. Sometimes they continue to rise far beyond the end of the preceding 3rd wave. Sometimes they come up short and never reach a price equal to or above that end point. They’re essentially unpredictable.
Internally, the present 5th wave will have five subwaves. The power of the overnight rise suggests that the uptrending 5th is in its 3rd of five subwaves.
Looking further ahead. From this point I’ll be referring to wave labels as they appear on the chart. The subscript in curly brackets shows the waves distance, within the fractal structure of the chart, from Intermediate degree. The latest Intermediate wave is 5{0}, which began in December 2018.
When the present 5th wave, labeled wave 5{-7} on the chart, reaches its end, it will be the end of trends stretching two degrees higher within the fractal structure of the chart: Waves 5{-6} and 5{-5}. It will also mark the end of the 3rd wave one degree higher that began on February 21, wave 3{-4}, and the beginning of a 4th-wave downward correction, wave 4{-4}, considerably larger than the small wave 4{-7} wave that ended on June 11.
What are the alternatives? It’s possible that the larger 5th subwave is actually a degree smaller, as are all of its subwaves, and that they are part of a 1st wave with a still larger 5th wave. On the chart, the larger 5th wave changes from 5{-6} to 5[-7}, wave 1{-6} is inserted into the line-up, They’re all subwaves if wave 5{-5}.
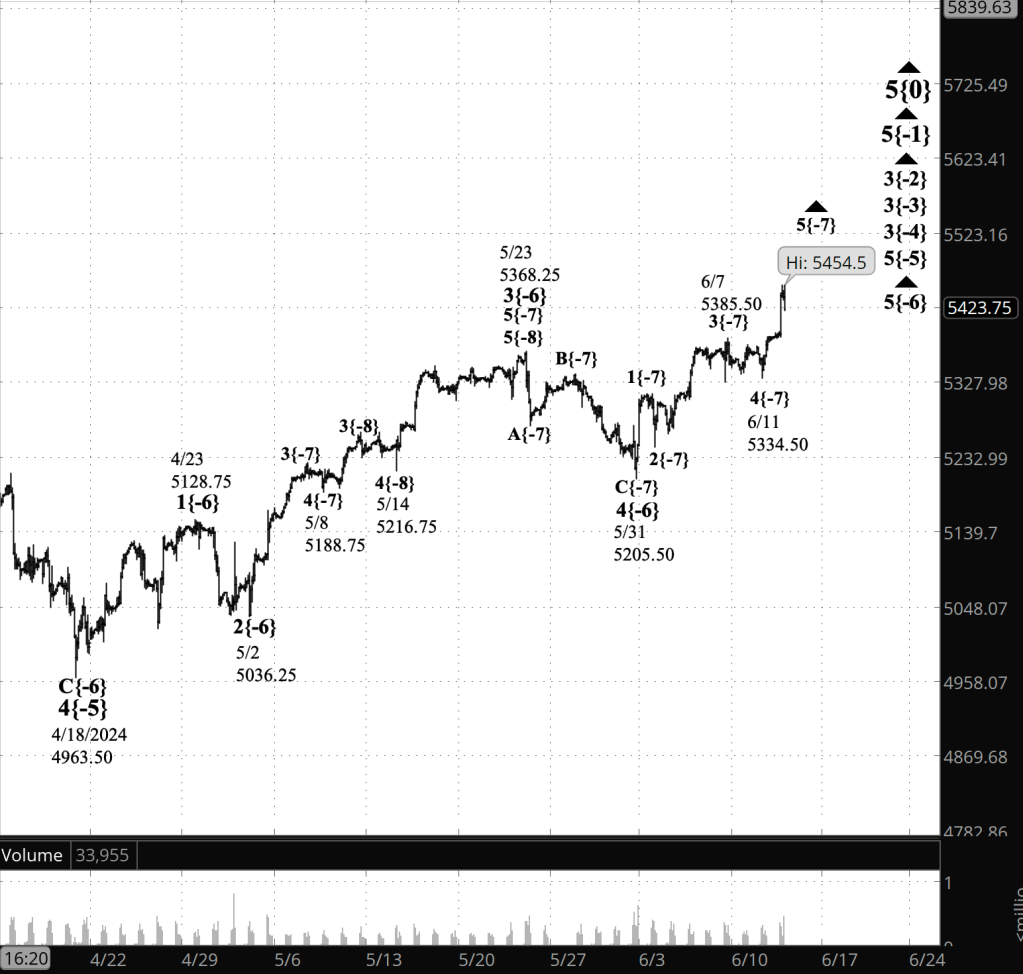
[S&P 500 E-mini futures at 3:30 p.m., 110-minute bars, with volume]
What does Elliott wave theory say? Here are the waves that underly the analyses.
Principal Analysis:
- Rising wave 5{0} is underway. It is a wave of Intermediate degree that began in December 2018.
- It is in its final subwave, wave 5{-1}.
- Within wave 5{-1}, rising waves 3{-2}, 3{-3} and 3{-4} are underway, as is wave 5{-5}.
- Wave 5{-6} is underway and is in its final subwave, uptrendng wave 5{-7}.
Reading the chart. Price movements — waves – – in Elliott wave analysis are labeled with numbers within trending waves and letters with corrective waves. The subscripts — numbers in curly brackets — designate the wave’s degree, which, in Elliott wave analysis, means the relative position of a wave within the larger and smaller structures that make up the chart. R.N. Elliott, who in the 1930s developed the form of analysis that bears his name, viewed the chart as a complex structure of smaller waves nested within larger waves, which in turn are nested within still larger waves. In mathematics it’s called a fractal structure, where at every scale the pattern is similar to the others.
Learning and other resources. Elliott wave analysis provides context, not prophecy. As the 20th century semanticist Alfred Korzybski put it in his book Science and Sanity (1933), “The map is not the territory … The only usefulness of a map depends on similarity of structure between the empirical world and the map.” And I would add, in the ever-changing markets, we can judge that similarity of structure only after the fact.
See the menu page Analytical Methods for a rundown on where to go for information on Elliott wave analysis.
By Tim Bovee, Portland, Oregon, June 12, 2024
Disclaimer
Tim Bovee, Private Trader tracks the analysis and trades of a private trader for his own accounts. Nothing in this blog constitutes a recommendation to buy or sell stocks, options or any other financial instrument. The only purpose of this blog is to provide education and entertainment.
No trader is ever 100 percent successful in his or her trades. Trading in the stock and option markets is risky and uncertain. Each trader must make trading decisions for his or her own account, and take responsibility for the consequences.
License
All content on Tim Bovee, Private Trader by Timothy K. Bovee is licensed under a Creative Commons Attribution-ShareAlike 4.0 International License.
Based on a work at www.timbovee.com.

You must be logged in to post a comment.