3:30 p.m. New York time
Half an hour before the closing bell.The S&P 500 futures worked their way lower during the session, coming close to 5400 before retracing a portion of the decline. Elliott Wave Theory: It’s all part of a small downward correction within the larger uptrending 5th wave that began on June 11. See this morning’s analysis for details.
I’ve updated the chart.
9:35 a.m. New York time
What’s happening now? The S&P 500 E-mini futures reached a low overnight in the 5420s and then rose sharply into the 5450s and retreated as the opening bell approached.
What does it mean? Elliott Wave Theory sees the overnight movement as part of a small uptrending 5th wave that began on June 11. Internally, that 5th wave is working through its middle subwave, wave 3.
Completion of the 5th wave will trigger the end of two other 5th waves of increasing size, and encompassing them all, 3rd wave that began on February 21. A 4th wave downward correction will follow.
A 4th wave typically typically ends within the range of the 4th subwave within the preceding 3rd wave, which in this case ran from the 5330s to the 4960s. The 3rd wave has lasted for four months, and the 4th wave downward correction will have a roughly consistent magnitude — likely lasting months, not weeks.
The target range and consistent magnitude are tendencies, not rules. There are many exceptions
What are the alternatives? It’s possible that the larger 5th subwave is actually a degree smaller, as are all of its subwaves, and that they are part of a 1st wave with a still larger 5th wave.
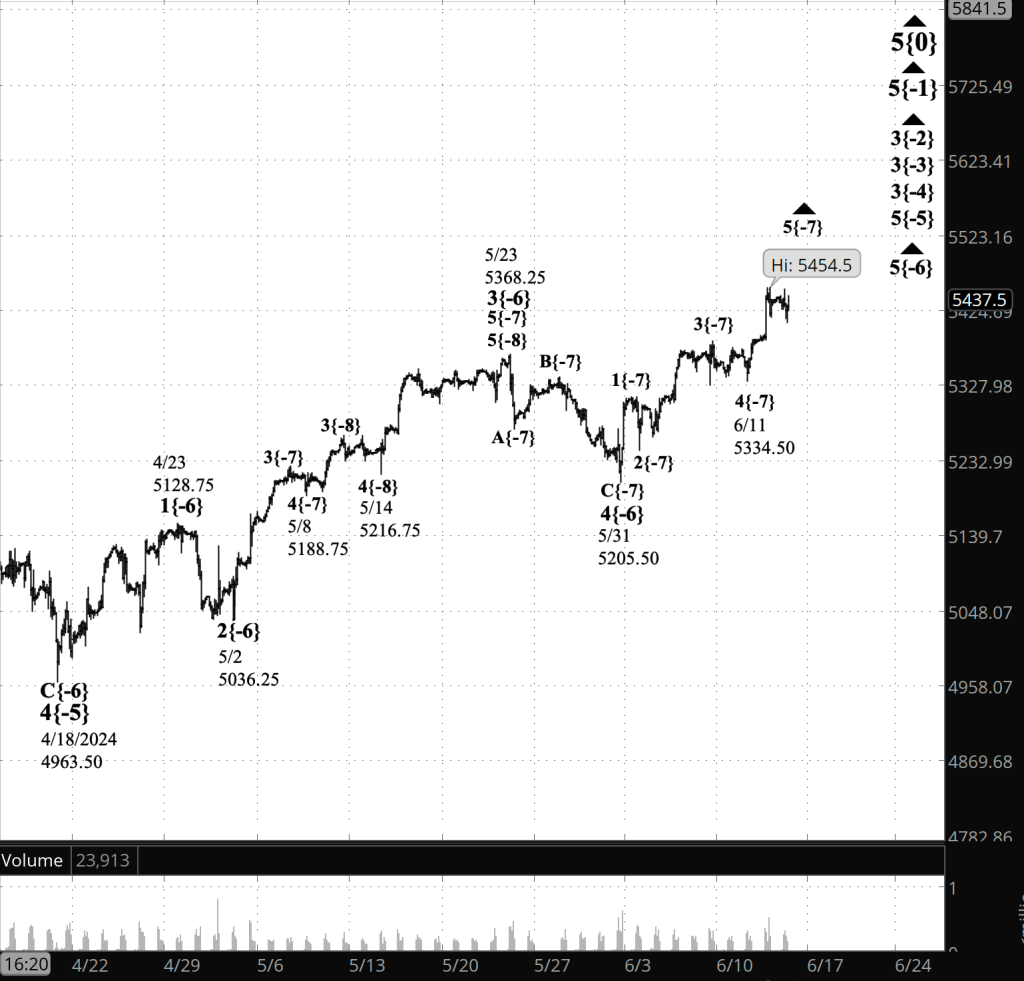
[S&P 500 E-mini futures at 3:30 p.m., 110-minute bars, with volume]
What does Elliott wave theory say? Here are the waves that underly the analyses.
Principal Analysis:
- Rising wave 5{0} is underway. It is a wave of Intermediate degree that began in December 2018.
- It is in its final subwave, wave 5{-1}.
- Within wave 5{-1}, rising waves 3{-2}, 3{-3} and 3{-4} are underway, as is wave 5{-5}.
- Wave 5{-6} is underway and is in its final subwave, uptrendng wave 5{-7}.
Reading the chart. Price movements — waves – – in Elliott wave analysis are labeled with numbers within trending waves and letters with corrective waves. The subscripts — numbers in curly brackets — designate the wave’s degree, which, in Elliott wave analysis, means the relative position of a wave within the larger and smaller structures that make up the chart. R.N. Elliott, who in the 1930s developed the form of analysis that bears his name, viewed the chart as a complex structure of smaller waves nested within larger waves, which in turn are nested within still larger waves. In mathematics it’s called a fractal structure, where at every scale the pattern is similar to the others.
Learning and other resources. Elliott wave analysis provides context, not prophecy. As the 20th century semanticist Alfred Korzybski put it in his book Science and Sanity (1933), “The map is not the territory … The only usefulness of a map depends on similarity of structure between the empirical world and the map.” And I would add, in the ever-changing markets, we can judge that similarity of structure only after the fact.
See the menu page Analytical Methods for a rundown on where to go for information on Elliott wave analysis.
By Tim Bovee, Portland, Oregon, June 13, 2024
Disclaimer
Tim Bovee, Private Trader tracks the analysis and trades of a private trader for his own accounts. Nothing in this blog constitutes a recommendation to buy or sell stocks, options or any other financial instrument. The only purpose of this blog is to provide education and entertainment.
No trader is ever 100 percent successful in his or her trades. Trading in the stock and option markets is risky and uncertain. Each trader must make trading decisions for his or her own account, and take responsibility for the consequences.
License
All content on Tim Bovee, Private Trader by Timothy K. Bovee is licensed under a Creative Commons Attribution-ShareAlike 4.0 International License.
Based on a work at www.timbovee.com.

You must be logged in to post a comment.