3:30 p.m. New York time
Half an hour before the closing bell. The S&P 500 futures rose durng the session, reaching into the 5500s. Elliott Wave Theory: The uptrending 5th-wave that began on June 14 continues and is in its 3rd of five subwaves. It’s 5th-wave of low degree, the sort of wave that’s here today and often gone within a week. However, it has large implications for the market’s journey through the next few months. See this morning’s discussion below.
I’ve updated the chart.
9:35 a.m. New York time
What’s happening now? The S&P 500 E-mini futures gapped up by more than 60 points as trading resumed overnight, reaching above 5500.
What does it mean? Elliott Wave Theory: The rise is the 5th and final subwave within a larger 5th wave that began on June 11, all part of a still larger 5th wave that began on May 31. And there is a still larger 5th wave encompassing the smaller ones, a wave that began on April 18.
The parade of the 5th waves. A 5th wave holds a special place in the fractal structure that underlies price movements in markets and that informs Elliott Wave Theory’s analysis. A 5th wave is an ending. When a 5th wave ends, the wave one degree larger also ends. And if that wave is a 5th wave, so does the next next higher wave.
On this chart we have a line-up of four uptrending 5th waves that we’re tracking. When the smallest, the 5th wave that began on April 18, reaches its end, it will also be the end of the increasingly larger 5th waves up to the one that began on April 18.
The next larger wave in the hierarchy is an uptrending 3rd wave that began on February 21 from 4959.
When the smallest of the 5th waves reaches its end, that event will cascade across the structure, putting the large 3rd wave to an end and beginning a 4th-wave downward correction that will retracement a portion — perhaps a large portion, perhaps not so large — of the 500-plus points of that uptrend.
How big is the smallest 5th wave? As I’ve noted before, 5th waves are quirky. Sometimes they extend for a barely imaginable distance. Sometimes they truncate, failing to move past the end of the preceding 4th wave.
What are the alternatives? I’ve listed an ongoing ambiguity in previous posts. I’m dropping it for now pending further analysis of the new line-up.
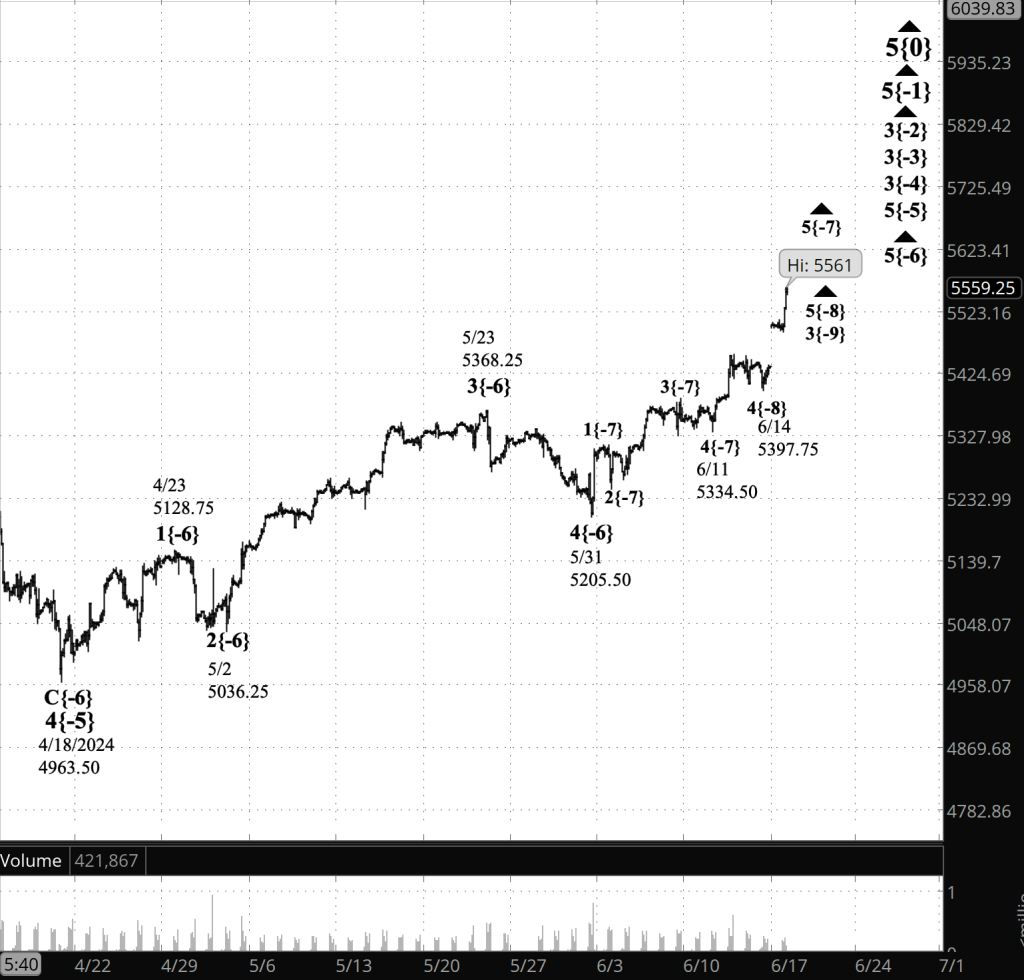
[S&P 500 E-mini futures at 3:30 p.m., 115-minute bars, with volume]
What does Elliott wave theory say? Here are the waves that underly the analyses.
Principal Analysis:
- Rising wave 5{0} is underway. It is a wave of Intermediate degree that began in December 2018.
- It is in its final subwave, wave 5{-1}.
- Within wave 5{-1}, rising waves 3{-2}, 3{-3} and 3{-4} are underway, as is wave 5{-5}.
- Wave 5{-6} is underway and is in its final subwave, uptrending wave 5{-7}, which is in wave 5{-8}, also an uptrend.
Reading the chart. Price movements — waves – – in Elliott wave analysis are labeled with numbers within trending waves and letters with corrective waves. The subscripts — numbers in curly brackets — designate the wave’s degree, which, in Elliott wave analysis, means the relative position of a wave within the larger and smaller structures that make up the chart. R.N. Elliott, who in the 1930s developed the form of analysis that bears his name, viewed the chart as a complex structure of smaller waves nested within larger waves, which in turn are nested within still larger waves. In mathematics it’s called a fractal structure, where at every scale the pattern is similar to the others.
Learning and other resources. Elliott wave analysis provides context, not prophecy. As the 20th century semanticist Alfred Korzybski put it in his book Science and Sanity (1933), “The map is not the territory … The only usefulness of a map depends on similarity of structure between the empirical world and the map.” And I would add, in the ever-changing markets, we can judge that similarity of structure only after the fact.
See the menu page Analytical Methods for a rundown on where to go for information on Elliott wave analysis.
By Tim Bovee, Portland, Oregon, June 17, 2024
Disclaimer
Tim Bovee, Private Trader tracks the analysis and trades of a private trader for his own accounts. Nothing in this blog constitutes a recommendation to buy or sell stocks, options or any other financial instrument. The only purpose of this blog is to provide education and entertainment.
No trader is ever 100 percent successful in his or her trades. Trading in the stock and option markets is risky and uncertain. Each trader must make trading decisions for his or her own account, and take responsibility for the consequences.
License
All content on Tim Bovee, Private Trader by Timothy K. Bovee is licensed under a Creative Commons Attribution-ShareAlike 4.0 International License.
Based on a work at www.timbovee.com.

You must be logged in to post a comment.