Market holiday on Wednesday. U.S. markets will be closed on Wednesday, June 19, for Juneteenth, a holiday celebrating the ending of slavery after of the American Civil War.
3:30 p.m. New York time
Half an hour before the closing bell. The S&P 500 futures leaned slightly toward the upside, reaching into the 5560s before scurrying back into the trading range established overnight.
The 5th-wave uptrend that began on June 14 continues and is in its final subwave.
I’ve updated the chart.
9:35 a.m. New York time
What’s happening now? The S&P 500 E-mini futures traded sideways overnight, fluctuating in the 5540s and 5550s.
What does it mean? In my principal analysis, Elliott Wave Theory sees the pause as a very small corrective wave within the 5th-wave uptrend that began on June 14. It will be followed by a resumption of the uptrend.
Bigger picture. The 5th-wave uptrend is of relatively small degree — days rather than weeks. It is the final wave within a 5th wave one degree higher, a condition that hold true for two additional 5th waves of still higher degrees.
Encompassing the 5th waves is a 3rd wave that began on February 21. The end of the 5th wave of highest degree in the present set up will also be the end of that 3rd wave and the beginning of a 4th-wave downward correction.
That 3rd wave and the 4th wave that will follow are of relatively large degree — months not weeks — and the downward correction will be large enough to cast doubt on the uptrend — “bull market” — that has been underway since April 18.
What are the alternatives? There is always a degree of ambiguity in figuring out where a wave belongs in the fractal hierarchy of the chart. In this discussion I’ll use the wave labels as they appear on the chart: A wave number followed by a subscript in curly brackets showing how many degrees removed from Intermediate degree the wave is. The present intermediate degree is wave 5{0}, which began in December 2018.
It’s possible that wave 5{-6}, which began on May 31, is actually a degree smaller than its present label says, as are all of its subwaves, and that they are part of a 1st wave with a still larger 5th wave. On the chart, the larger 5th wave changes from 5{-6} to 5[-7}, wave 1{-6} is inserted into the line-up, They’re all subwaves if wave 5{-5}.
One major effect of this alternative, if in fact it proves to be accurate, would be to delay the large 4th-wave downward correction discussed in the principal analysis. The wave of that degree is presently 3{-4}, and the future downward correction will be wave 4{-4}. The alternative analysis means that the newly identified waves 1{-6} through 5{-6} will need to reach completion before wave 5{-5} is complete, triggering the wave 4{-4} downward correction. Before that, a 2nd wave downward correction, wave 2{-6}, will occur.
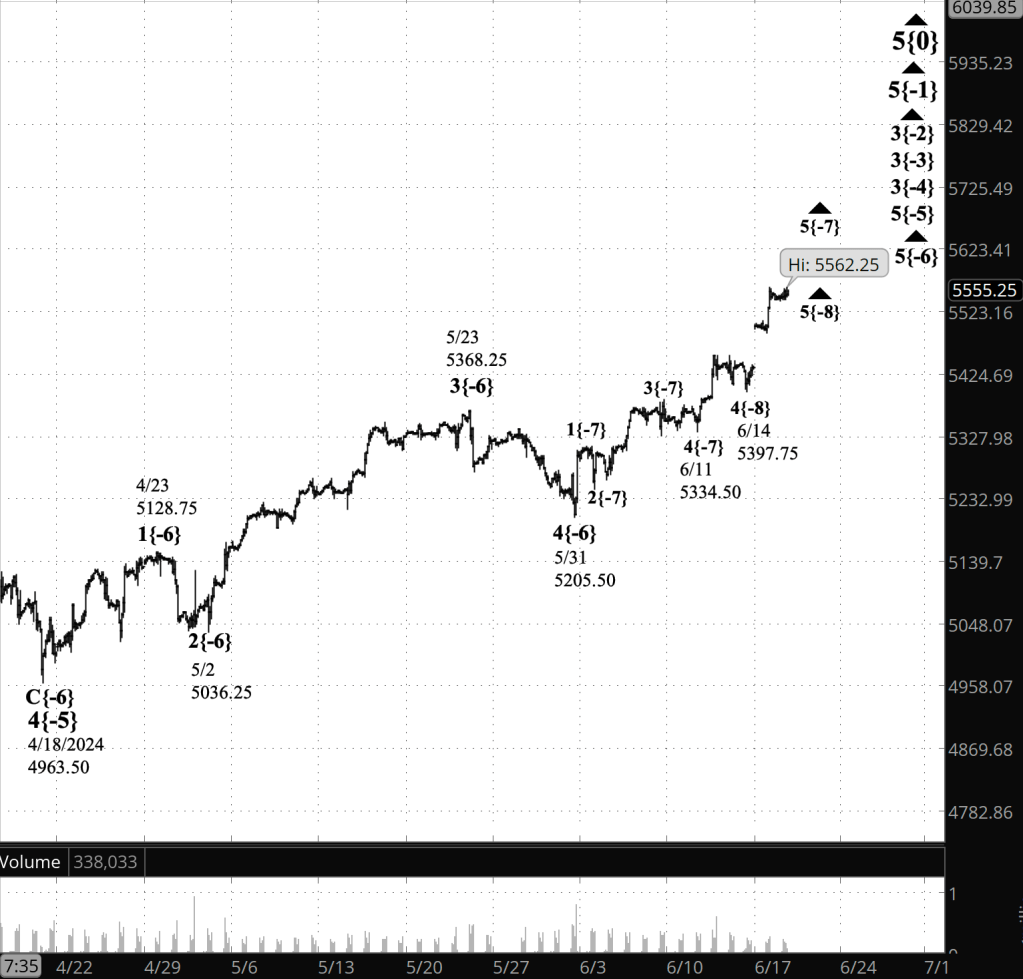
[S&P 500 E-mini futures at 3:30 p.m., 115-minute bars, with volume]
What does Elliott wave theory say? Here are the waves that underly the analyses.
Principal Analysis:
- Rising wave 5{0} is underway. It is a wave of Intermediate degree that began in December 2018.
- It is in its final subwave, wave 5{-1}.
- Within wave 5{-1}, rising waves 3{-2}, 3{-3} and 3{-4} are underway, as is wave 5{-5}.
- Wave 5{-6} is underway and is in its final subwave, uptrending wave 5{-7}.
Alternative Analysis
- Within wave 5{-1}, rising waves 3{-2}, 3{-3} and 3{-4} are underway, as is wave 5{-5}.
- Wave 1{-6} is underway, and is in its final subwave, uptrending wave 5{-7}.
Reading the chart. Price movements — waves – – in Elliott wave analysis are labeled with numbers within trending waves and letters with corrective waves. The subscripts — numbers in curly brackets — designate the wave’s degree, which, in Elliott wave analysis, means the relative position of a wave within the larger and smaller structures that make up the chart. R.N. Elliott, who in the 1930s developed the form of analysis that bears his name, viewed the chart as a complex structure of smaller waves nested within larger waves, which in turn are nested within still larger waves. In mathematics it’s called a fractal structure, where at every scale the pattern is similar to the others.
Learning and other resources. Elliott wave analysis provides context, not prophecy. As the 20th century semanticist Alfred Korzybski put it in his book Science and Sanity (1933), “The map is not the territory … The only usefulness of a map depends on similarity of structure between the empirical world and the map.” And I would add, in the ever-changing markets, we can judge that similarity of structure only after the fact.
See the menu page Analytical Methods for a rundown on where to go for information on Elliott wave analysis.
By Tim Bovee, Portland, Oregon, June 18, 2024
Disclaimer
Tim Bovee, Private Trader tracks the analysis and trades of a private trader for his own accounts. Nothing in this blog constitutes a recommendation to buy or sell stocks, options or any other financial instrument. The only purpose of this blog is to provide education and entertainment.
No trader is ever 100 percent successful in his or her trades. Trading in the stock and option markets is risky and uncertain. Each trader must make trading decisions for his or her own account, and take responsibility for the consequences.
License
All content on Tim Bovee, Private Trader by Timothy K. Bovee is licensed under a Creative Commons Attribution-ShareAlike 4.0 International License.
Based on a work at www.timbovee.com.

[…] count, then it would delay the onset or the 4th-wave downward correction, wave 4{-4}. See the June 18 Trader’s Notebook for a more detailed […]
LikeLike
[…] count, then it would delay the onset or the 4th-wave downward correction, wave 4{-4}. See the June 18 Trader’s Notebook for a more detailed […]
LikeLike
[…] count, then it would delay the onset or the 4th-wave downward correction, wave 4{-4}. See the June 18 Trader’s Notebook for a more detailed […]
LikeLike