3:30 p.m. New York time
Half an hour before the closing bell. The S&P 500 futures rose during the session, returning to the 5550s.
Applying Elliott Wave Theory, the analysis shows that rise is most likely part of the declining C wave that began on June 28. The session high so far has remained below the C-wave’s starting point. A move above that starting point would signal that the C wave and its parent 4th-wave downward correction, which began on June 20, have ended and a that a 5th-wave uptrend is underway.
Another approach: The C wave when complete will have five subwaves. I count it the present subwave as being the 2nd, although there are some ambiguities in the pattern on the chart. This argues for wave C still being underway.
I’ve retained the wave count from this morning’s analysis. The final subwave, wave C, of the 4th-wave downward correction continues.
9:35 a.m. New York time
What’s happening now? The S&P 500 E-mini futures fell overnight, from the 5530s to just above 5500, rising into the 5520s after the opening bell.
What does it mean? Elliott Wave Theory sees the overnight pattern as a continuation of the final subwave, wave C, within the 4th-wave downtrend that began on June 20. The C wave began on June 28.
The 4th wave will be complete when wave C reaches its end, and a 5th-wave uptrend will begin. the end of the 5th wave will trigger the end of three larger 5th waves, each larger than the one before it. The smaller 5th wave began on June 11, the next larger on May 31, and the largest on April 18.
Move up one degree higher within the fractal structure of the chart, and we’ll see that the end of those 5th waves is also the end of a 3rd-wave uptrend that began on February 21 from 4959.
A 4th-wave downtrend will follow that 3rd wave. A 4th wave tends to end within the 4th subwave of the preceding 3rd wave. Wave 4 within the 3rd-wave uptrend now underway began on March 14 and ended on March 15, ranging from 5253.50 down to 5167.75. That’s the target range for the future 4th-wave correction. However that reflects a tendency, not a firm rule, and the future 4th-wave could end above or below that range.
What are the alternatives? There may be a 1st wave on the chart, between wave 5{-6} and 5{-5}. If that’s the proper count, then it would delay the onset or the 4th-wave downward correction, wave 4{-4}. See the June 18 Trader’s Notebook for a more detailed discussion.
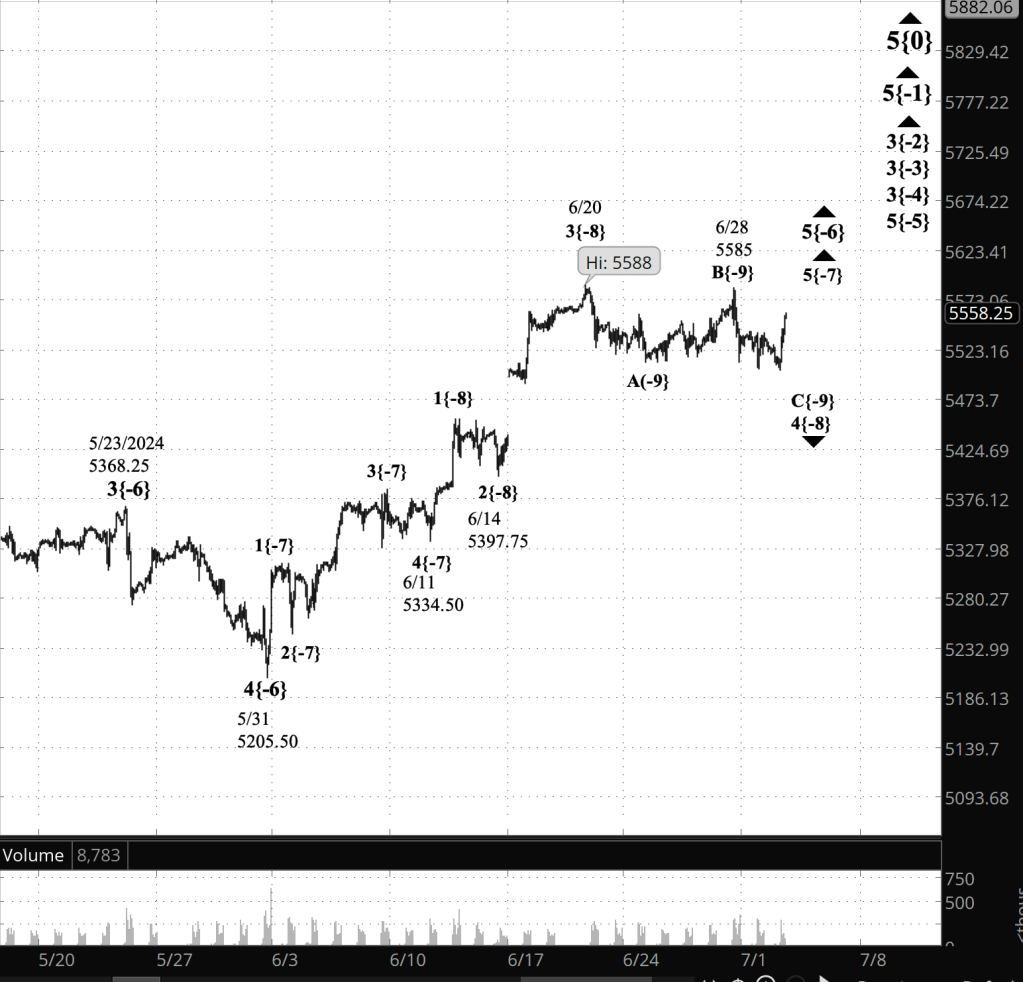
[S&P 500 E-mini futures at 3:30 p.m., 180-minute bars, with volume]
What does Elliott wave theory say? Here are the waves that underly the analyses.
Principal Analysis:
- Rising wave 5{0} is underway. It is a wave of Intermediate degree that began in December 2018.
- It is in its final subwave, wave 5{-1}.
- Within wave 5{-1}, rising waves 3{-2}, 3{-3} and 3{-4} are underway, as is wave 5{-5}.
- Wave 5{-6} is underway and is in its final subwave, uptrending wave 5{-7} and its subwave, downtrending wave 4{-8}, a corrective wave.
- Wave 4{-8} is in its final subwave, declining wave C{-9}.
Reading the chart. Price movements — waves – – in Elliott wave analysis are labeled with numbers within trending waves and letters with corrective waves. The subscripts — numbers in curly brackets — designate the wave’s degree, which, in Elliott wave analysis, means the relative position of a wave within the larger and smaller structures that make up the chart. R.N. Elliott, who in the 1930s developed the form of analysis that bears his name, viewed the chart as a complex structure of smaller waves nested within larger waves, which in turn are nested within still larger waves. In mathematics it’s called a fractal structure, where at every scale the pattern is similar to the others.
Learning and other resources. Elliott wave analysis provides context, not prophecy. As the 20th century semanticist Alfred Korzybski put it in his book Science and Sanity (1933), “The map is not the territory … The only usefulness of a map depends on similarity of structure between the empirical world and the map.” And I would add, in the ever-changing markets, we can judge that similarity of structure only after the fact.
See the menu page Analytical Methods for a rundown on where to go for information on Elliott wave analysis.
By Tim Bovee, Portland, Oregon, July 2, 2024
Disclaimer
Tim Bovee, Private Trader tracks the analysis and trades of a private trader for his own accounts. Nothing in this blog constitutes a recommendation to buy or sell stocks, options or any other financial instrument. The only purpose of this blog is to provide education and entertainment.
No trader is ever 100 percent successful in his or her trades. Trading in the stock and option markets is risky and uncertain. Each trader must make trading decisions for his or her own account, and take responsibility for the consequences.
License
All content on Tim Bovee, Private Trader by Timothy K. Bovee is licensed under a Creative Commons Attribution-ShareAlike 4.0 International License.
Based on a work at www.timbovee.com.

You must be logged in to post a comment.