12:30 p.m. New York time
Half an hour before the closing bell. The S&P 500 futures rose during the session. In the terminology of Elliott Wave Theory, according to this morning’s analysis, a subwave of wave C broke past the C wave’s starting point, 5585.
This morning I said that a break above that level would increase the likelihood that wave C ended on on July 2 at 5502.5, completing the 4th-wave downward correction and beginning a 5th-wave uptrend. That has now occurred.
The next significant level is the starting point of the 4th-wave downward correction, 5588, on June 20. The price continued to rise after the first breakout and has broken above the starting point of the correction, so far reaching 5589.
There’s no rule that says a break past the wave 4 starting point means wave 4 has ended. But it’s a strong enough indicator for me to update the analysis.
An uptrend has begun. The 4th-wave downward correction that began on June 20 from 5588 ended on July 3 at 3502.75, and a 5th-wave uptrend has begun. A 5th wave can be quirky. Sometimes it ends quickly, and sometimes it extends for extraordinary gains. There’s no of telling which sort of 5th wave this is.
When the 5th wave is complete, it will also be the end of 5th waves three levels higher in the fractal structure of the chart, and a 3rd wave another level higher. A downward correction will follow.
9:35 a.m. New York time
Markets close early. U.S markets will close at 1 p.m. New York time today, three hours early, in anticipation of July 4th’s Independence Day celebration. Markets will be closed on Thursday and will return to the regular schedule on Friday.
I’ll post the closing Trader’s Notebook update today at 12:30 p.m. I’ll post no Trader’s Notebook on Thursday and will return to the regular schedule on Friday: A post five minutes after the opening bell, at 9:35 a.m. and an update half an hour before the closing bell, at 1 p.m. All times are New York time.
What’s happening now? The S&P 500 E-mini futures rose overnight from the 5550s to the 5570s and then fell, declining further with the release of the ADP Employment Report by the ADP Research Institute, a private-sector company that provides data about labor market and employee data research. The report serves as a sneak preview on the jobs portion of the government’s Employment Situation Report, which will be released on Friday before the opening bell. The ADP report has data on jobs but not on unemployment, the latter being the headline number of the government’s employment report.
The price rose back into the 5570s after the opening bell.
What does it mean? The rise and decline stayed within the range of the June 28 high and the July 2 low.
In applying Elliott Wave Theory to the analysis of charts, I prefer to have a positive reason to declare that one wave has ended and another one has begun. Absent a breakout in any direction, this analysis will be unchanged from yesterday’s: Wave C, which began on June 28, continues. It is the final subwave within a 4th-wave downward correction that began on June 20.
If the price breaks above the June 28 high, 5585, that will strengthen the case that wave C has ended and the following 5th-wave uptrend has begun. A break below the July 2 low, 5502.75, will strengthen the case that wave C is still underway.
What are the alternatives? It’s possible that the new 5th wave is a head-fake and the 4th-wave correction is continuing.
There may be a 1st wave on the chart, between wave 5{-6} and 5{-5}. If that’s the proper count, then it would delay the onset or the 4th-wave downward correction, wave 4{-4}. See the June 18 Trader’s Notebook for a more detailed discussion.
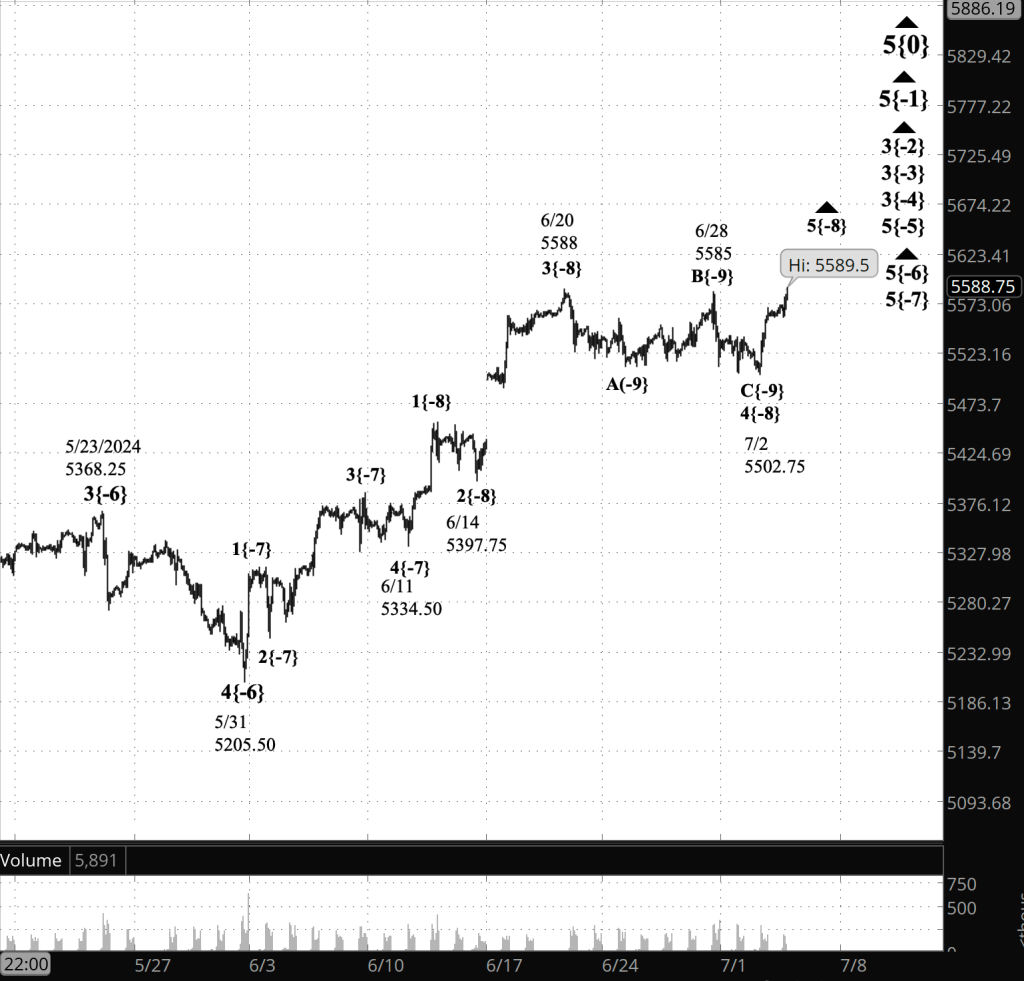
[S&P 500 E-mini futures at 12:30 a.m., 80-minute bars, with volume]
What does Elliott wave theory say? Here are the waves that underly the analyses.
Principal Analysis:
Updated with the afternoon analysis]
- Rising wave 5{0} is underway. It is a wave of Intermediate degree that began in December 2018.
- It is in its final subwave, wave 5{-1}.
- Within wave 5{-1}, rising waves 3{-2}, 3{-3} and 3{-4} are underway, as is wave 5{-5}.
- Wave 5{-6} is underway and is in its final subwave, uptrending wave 5{-7}, which in turn is in its final subwave, uptrending wave 5{-8}.
Reading the chart. Price movements — waves – – in Elliott wave analysis are labeled with numbers within trending waves and letters with corrective waves. The subscripts — numbers in curly brackets — designate the wave’s degree, which, in Elliott wave analysis, means the relative position of a wave within the larger and smaller structures that make up the chart. R.N. Elliott, who in the 1930s developed the form of analysis that bears his name, viewed the chart as a complex structure of smaller waves nested within larger waves, which in turn are nested within still larger waves. In mathematics it’s called a fractal structure, where at every scale the pattern is similar to the others.
Learning and other resources. Elliott wave analysis provides context, not prophecy. As the 20th century semanticist Alfred Korzybski put it in his book Science and Sanity (1933), “The map is not the territory … The only usefulness of a map depends on similarity of structure between the empirical world and the map.” And I would add, in the ever-changing markets, we can judge that similarity of structure only after the fact.
See the menu page Analytical Methods for a rundown on where to go for information on Elliott wave analysis.
By Tim Bovee, Portland, Oregon, July 3, 2024
Disclaimer
Tim Bovee, Private Trader tracks the analysis and trades of a private trader for his own accounts. Nothing in this blog constitutes a recommendation to buy or sell stocks, options or any other financial instrument. The only purpose of this blog is to provide education and entertainment.
No trader is ever 100 percent successful in his or her trades. Trading in the stock and option markets is risky and uncertain. Each trader must make trading decisions for his or her own account, and take responsibility for the consequences.
License
All content on Tim Bovee, Private Trader by Timothy K. Bovee is licensed under a Creative Commons Attribution-ShareAlike 4.0 International License.
Based on a work at www.timbovee.com.

You must be logged in to post a comment.