3:30 p.m. New York time
Half an hour before the closing bell. The S&P 500 futures rose during the session, peaking at 5645.75 and then withdrawing into the 5630s. The session high was slightly beyond the overnight peak of 5640.
This morning’s Elliott Wave Analysis is unchanged. Uptrending wave 5, which began on July 2, continues and is in its middle subwave, wave 3.
I’ve updated the lower chart, which mid-May to the present. The upper chart, which begin in late June, has not been updated from this morning’s version showing wave 5’s internal count.
9:35 a.m. New York time
What’s happening now? The S&P 500 E-mini futures rose overnight, reaching into the 5640s.
What does it mean? The Elliott Wave Theory analysis remans unchanged the the day before: A 5th-wave uptrend that began on June 2 continues.
So far wave 5 has covered about 140 points in a week. The preceding 3rd wave within the the enclosing structure — a larger 5th wave that began on June 11 — covered about 190 points in six days.
Subwaves. In counting the subwaves of a trend, it sometimes comes down to avoiding overly short 3rd waves.. A trend has five subwaves — three trending in the direction of the larger trend and two corrections — and a firm rule of Elliott Wave Theory forbids a 3rd wave from being the shortest of the trending waves. In practice, I’ve found the 3rd wave to almost always be the longest of the trending waves.
So applying that rule of thumb, heres the very tentative subwave count that I come up with.
The waves on the chart have a subscript in brackets showing the wave’s distance in the fractal structure of the chart from Intermediate Degree. The current wave of that degree is wave 5{0}, which began in December 2018.
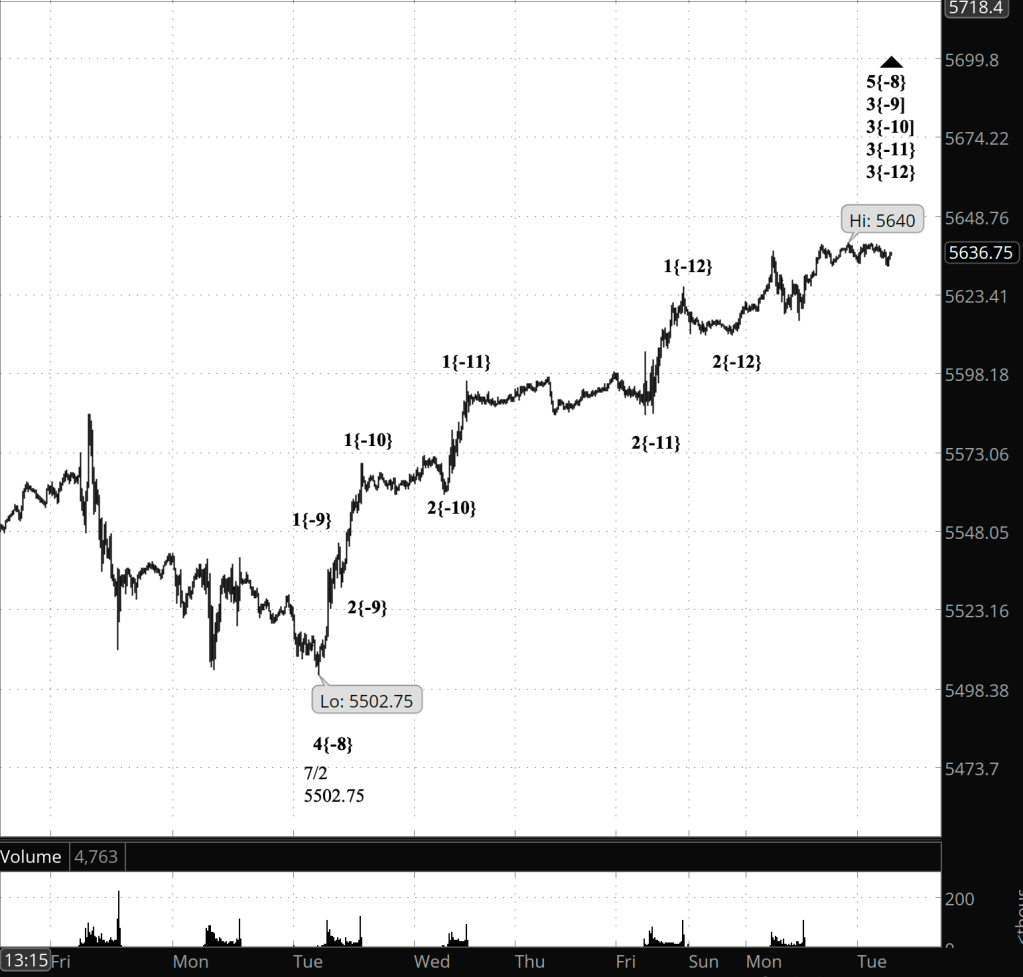
[S&P 500 E-mini futures at 9:17 a.m., 15-minute bars, with volume]
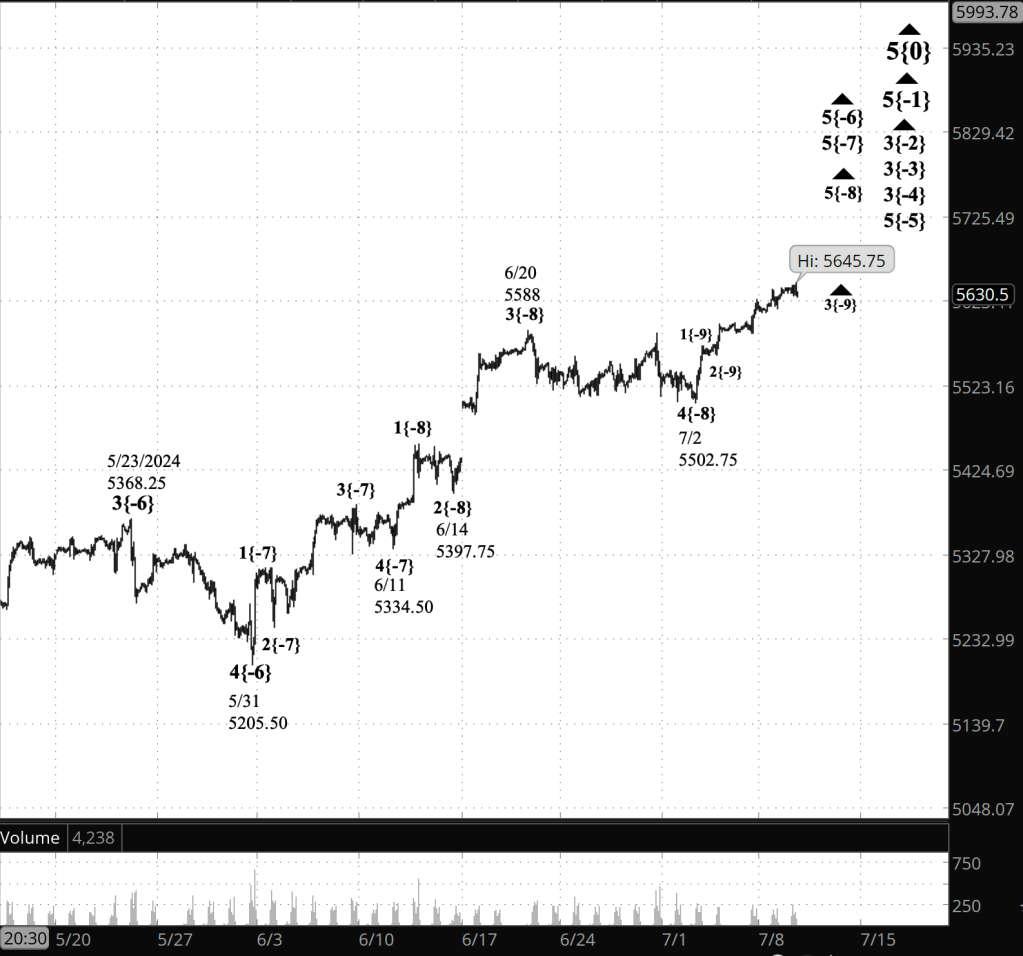
[S&P 500 E-mini futures at 3:30 p.m., 90-minute bars, with volume]
What are the alternatives? There may be a 1st wave on the chart, between wave 5{-6} and 5{-5}. If that’s the proper count, then it would delay the onset or the 4th-wave downward correction, wave 4{-4}. See the June 18 Trader’s Notebook for a more detailed discussion. As the uptrend progresses, this alternative is appearing to be less likely.
What does Elliott wave theory say? Here are the waves that underly the analyses.
Principal Analysis:
- Rising wave 5{0} is underway. It is a wave of Intermediate degree that began in December 2018.
- It is in its final subwave, wave 5{-1}.
- Within wave 5{-1}, rising waves 3{-2}, 3{-3} and 3{-4} are underway, as is wave 5{-5}.
- Wave 5{-6} is underway and is in its final subwave, uptrending wave 5{-7}, which in turn is in its final subwave, uptrending wave 5{-8}.
- Within wave 5{-8}, an uptrending subwave, wave 3{-9}, is in progress.
Reading the chart. Price movements — waves – – in Elliott wave analysis are labeled with numbers within trending waves and letters with corrective waves. The subscripts — numbers in curly brackets — designate the wave’s degree, which, in Elliott wave analysis, means the relative position of a wave within the larger and smaller structures that make up the chart. R.N. Elliott, who in the 1930s developed the form of analysis that bears his name, viewed the chart as a complex structure of smaller waves nested within larger waves, which in turn are nested within still larger waves. In mathematics it’s called a fractal structure, where at every scale the pattern is similar to the others.
Learning and other resources. Elliott wave analysis provides context, not prophecy. As the 20th century semanticist Alfred Korzybski put it in his book Science and Sanity (1933), “The map is not the territory … The only usefulness of a map depends on similarity of structure between the empirical world and the map.” And I would add, in the ever-changing markets, we can judge that similarity of structure only after the fact.
See the menu page Analytical Methods for a rundown on where to go for information on Elliott wave analysis.
By Tim Bovee, Portland, Oregon, July 9, 2024
Disclaimer
Tim Bovee, Private Trader tracks the analysis and trades of a private trader for his own accounts. Nothing in this blog constitutes a recommendation to buy or sell stocks, options or any other financial instrument. The only purpose of this blog is to provide education and entertainment.
No trader is ever 100 percent successful in his or her trades. Trading in the stock and option markets is risky and uncertain. Each trader must make trading decisions for his or her own account, and take responsibility for the consequences.
License
All content on Tim Bovee, Private Trader by Timothy K. Bovee is licensed under a Creative Commons Attribution-ShareAlike 4.0 International License.
Based on a work at www.timbovee.com.

You must be logged in to post a comment.