3:30 p.m. New York time
Half an hour before the closing bell. The S&P 500 futures continued to rise during the session, reaching above 5700. The chart has the look-and-feel, to me, at least, of another head-fake in the making, a repeat of yesterday’s need to correct the morning analysis.
For this afternoon’s Elliott Wave Theory analysis, I’ve retained labeling that has a 4th-wave downward correction that began on July 11 in progress. It’s a subwave of a larger 5th-wave uptrend that began on July 2.
Fourth waves have three subwaves within the initial wave, and I’ve labeled that subwave, wave A, as having ended at the overnight low. With that labeling, wave A has three subwaves, meaning that the correction is taking the form of a Flat.
The rise that followed is the B wave, the second subwave within the correction. In the Flat form, a B wave can move above the start of the preceding A wave, and that is what has happened. The B wave will have three subwaves. If this count turns out to match the future course of the chart, then the rising B wave will followed by a declining C wave with five subwaves that will complete the 4th-wave correction.
Now to the potential head-fake: It’s possible to count the wave A decline, as discussed above, as being the entire 4th-wave correction, with three subwaves and a lack of clarity within those subwaves. That lack of clarity has led me to demote this second analysis to an Alternative status. Under this scenario, today’s rise during the session is a 5th-wave uptrend, the final subwave of the larger 5th wave that began on July 2.
And now we wait for the unfolding reality of the chart to grade our work.
I’ve updated the chart.
9:35 a.m. New York time
What’s happening now? The S&P 500 E-mini futures traded sideways overnight, dropping by 18 points when new Producer Price Index data was released. The price returned to its prior level in the next minute.
What does it mean? Analysis based on Elliott Wave Theory concludes that a low-degree 4th-wave downward correction that began on July 11 continues. when it is complete, a 5th-wave uptrend will following, bringing the parent wave — also a 5th-wave uptrend — to a conclusion.
A series of three nested 5th wave, each a degree higher than the one before, will simultaneously com to an end. The entire structure is within a 3rd wave uptrend that began on February 21. When those 5th waves end, the larger 3rd wave will also end and a large 4th-wave downtrend will begin.
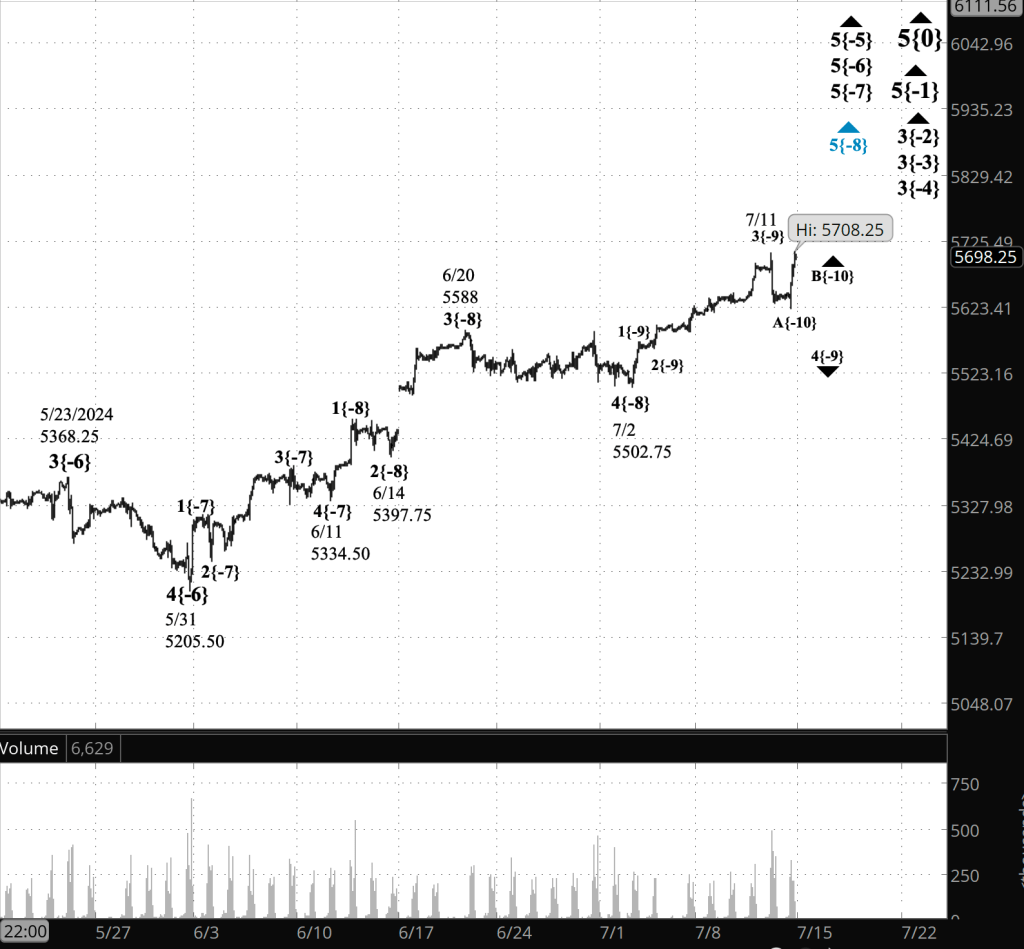
[S&P 500 E-mini futures at 3:30 p.m., 90-minute bars, with volume]
What are the alternatives? There may be a 1st wave on the chart, between wave 5{-6} and 5{-5}. If that’s the proper count, then it would delay the onset or the 4th-wave downward correction, wave 4{-4}. See the June 18 Trader’s Notebook for a more detailed discussion. As the uptrend progresses, this alternative is appearing to be less likely.
What does Elliott wave theory say? Here are the waves that underly the analyses.
Principal Analysis:
- Rising wave 5{0} is underway. It is a wave of Intermediate degree that began in December 2018.
- It is in its final subwave, wave 5{-1}.
- Within wave 5{-1}, rising waves 3{-2}, 3{-3} and 3{-4} are underway, as is wave 5{-5}.
- Wave 5{-6} is underway and is in its final subwave, uptrending wave 5{-7}, which in turn is in its final subwave, uptrending wave 5{-8}.
- Within wave 5{-8}, a downward correction, wave 4{-9}, is in progress.
Reading the chart. Price movements — waves – – in Elliott wave analysis are labeled with numbers within trending waves and letters with corrective waves. The subscripts — numbers in curly brackets — designate the wave’s degree, which, in Elliott wave analysis, means the relative position of a wave within the larger and smaller structures that make up the chart. R.N. Elliott, who in the 1930s developed the form of analysis that bears his name, viewed the chart as a complex structure of smaller waves nested within larger waves, which in turn are nested within still larger waves. In mathematics it’s called a fractal structure, where at every scale the pattern is similar to the others.
Learning and other resources. Elliott wave analysis provides context, not prophecy. As the 20th century semanticist Alfred Korzybski put it in his book Science and Sanity (1933), “The map is not the territory … The only usefulness of a map depends on similarity of structure between the empirical world and the map.” And I would add, in the ever-changing markets, we can judge that similarity of structure only after the fact.
See the menu page Analytical Methods for a rundown on where to go for information on Elliott wave analysis.
By Tim Bovee, Portland, Oregon, July 12, 2024
Disclaimer
Tim Bovee, Private Trader tracks the analysis and trades of a private trader for his own accounts. Nothing in this blog constitutes a recommendation to buy or sell stocks, options or any other financial instrument. The only purpose of this blog is to provide education and entertainment.
No trader is ever 100 percent successful in his or her trades. Trading in the stock and option markets is risky and uncertain. Each trader must make trading decisions for his or her own account, and take responsibility for the consequences.
License
All content on Tim Bovee, Private Trader by Timothy K. Bovee is licensed under a Creative Commons Attribution-ShareAlike 4.0 International License.
Based on a work at www.timbovee.com.

You must be logged in to post a comment.