3:30 p.m. New York time
Half an hour before the closing bell. The S&P 500 futures climbed back into the 5710s during the session, so far remaining below the overnight high by a few points.
This morning’s Elliott Wave Theory analysis is unchanged: Wave C within the 4th-wave upward correction that began on July 11 continues.
I’ve updated the chart.
9:35 a.m. New York time
What’s happening now? The S&P 500 E-mini futures traded in a narrow range overnight, remaining in the 5690s except for a decline into the 5670s and then back.
What does it mean? Elliott Wave Theory sees the pause as part of the third subwave — wave C — within the 4th-wave downward correction that began on July 11. The correction is taking the form of a Flat, with waves A and B having three subwaves and wave C, five subwaves.
A C wave within a Flat typically is equal to the length of wave A or up to 65% longer. The A wave in this correction covered 86.5 points. Multiplying by 1.65 gives a length of 142.73.
Wave C began from 5718.75. That gives a range for wave C of between 5632.25 and 5576 (rounding the results to the 25-cent increments used by the S&P 500 futures), which at its longest would bring the price down to where it was in early July.
As I’ve noted in earlier posts, this is a small correction. However, there is a much larger correction in view.
The present 4th-wave corection will be followed by a small 5th-wave uptrend, whose end will also be the end of four 5th waves of increasing size, and of a still larger 3rd wave. that began on February 21. A 4th-wave downward correction of the larger 3rd wave will begin. That 4th-wave correction will be five degrees (or levels) larger than the present 4th-wave correction within the fractal structure of the chart.
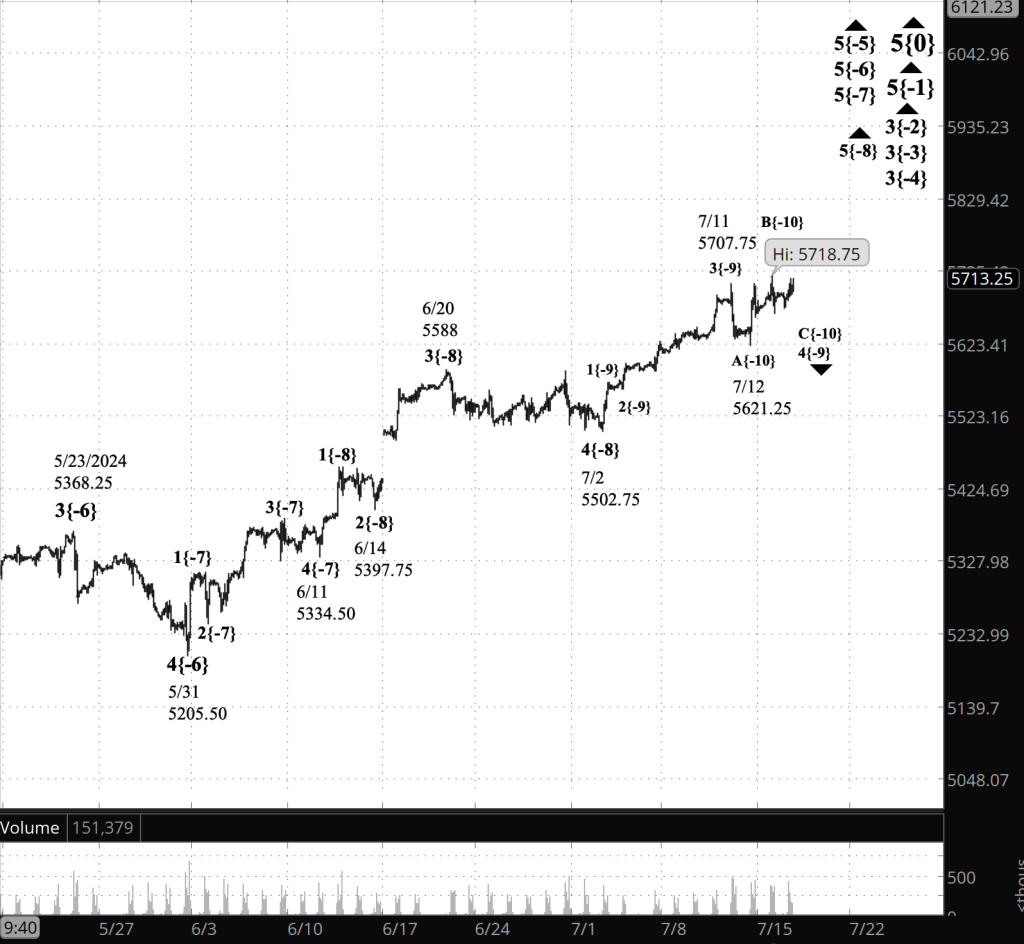
[S&P 500 E-mini futures at 3:30 p.m., 100-minute bars, with volume]
What are the alternatives? Unchanged for the past few weeks. There may be a 1st wave on the chart, between wave 5{-6} and 5{-5}. If that’s the proper count, then it would delay the onset or the 4th-wave downward correction, wave 4{-4}. See the June 18 Trader’s Notebook for a more detailed discussion. As the uptrend progresses, this alternative is appearing to be less likely.
What does Elliott wave theory say? Here are the waves that underly the analyses.
Principal Analysis:
- Rising wave 5{0} is underway. It is a wave of Intermediate degree that began in December 2018.
- It is in its final subwave, wave 5{-1}.
- Within wave 5{-1}, rising waves 3{-2}, 3{-3} and 3{-4} are underway, as is wave 5{-5}.
- Wave 5{-6} is underway and is in its final subwave, uptrending wave 5{-7}, which in turn is in its final subwave, uptrending wave 5{-8}.
- Within wave 5{-8}, a downward correction, wave 4{-9}, is in progress.
- Wave 4{-9} is in its final subwave, wave C{-10}
Reading the chart. Price movements — waves – – in Elliott wave analysis are labeled with numbers within trending waves and letters with corrective waves. The subscripts — numbers in curly brackets — designate the wave’s degree, which, in Elliott wave analysis, means the relative position of a wave within the larger and smaller structures that make up the chart. R.N. Elliott, who in the 1930s developed the form of analysis that bears his name, viewed the chart as a complex structure of smaller waves nested within larger waves, which in turn are nested within still larger waves. In mathematics it’s called a fractal structure, where at every scale the pattern is similar to the others.
Learning and other resources. Elliott wave analysis provides context, not prophecy. As the 20th century semanticist Alfred Korzybski put it in his book Science and Sanity (1933), “The map is not the territory … The only usefulness of a map depends on similarity of structure between the empirical world and the map.” And I would add, in the ever-changing markets, we can judge that similarity of structure only after the fact.
See the menu page Analytical Methods for a rundown on where to go for information on Elliott wave analysis.
By Tim Bovee, Portland, Oregon, July 16, 2024
Disclaimer
Tim Bovee, Private Trader tracks the analysis and trades of a private trader for his own accounts. Nothing in this blog constitutes a recommendation to buy or sell stocks, options or any other financial instrument. The only purpose of this blog is to provide education and entertainment.
No trader is ever 100 percent successful in his or her trades. Trading in the stock and option markets is risky and uncertain. Each trader must make trading decisions for his or her own account, and take responsibility for the consequences.
License
All content on Tim Bovee, Private Trader by Timothy K. Bovee is licensed under a Creative Commons Attribution-ShareAlike 4.0 International License.
Based on a work at www.timbovee.com.

You must be logged in to post a comment.