3:30 p.m. New York time
Half an hour before the closing bell. The S&P 500 futures continued to fall during the session, breaking below the lower boundary of the price target range. Elliott Wave Theory: The 4th-wave downward correction that began on July 11 is in its final subwave — wave C.
In his morning’s post I gave two possible interpretations of wave C’s internal structure, saying that the overnight decline was either a subwave within the 3rd subwave of wave C, or is itself wave C’s 4th subwave. The session decline resolves the ambiguity in favor of the 4th subwave within wave C.
I’ve updated the hart.
9:35 a.m. New York time
What’s happening now? The S&P 500 E-mini futures declined overnight, testing the lower boundary of the price target range, and then rose in what ended up being a net sideways movement.
What does it mean? Elliott Wave Theory sees the movement as a very small correction within the final subwave — wave C — of the 4th-wave downward correction that began on July 11. Wave C will have five subwaves. The target range marked on the chart in red are the typical end point of a C wave, although its not a firm rule.
The overnight pause is either a subwave within the 3rd subwave of wave C, or is itself wave C’s 4th subwave. In either case, the correction that began on July 11 is nearing its end.
Long story short. Nothing has changed in the analysis, nor in the scenario for the future. The correction of the past eight days will be followed by a 5th-wave uptrend. The end of this smaller 5th wave will also be the end of a series of four 5th waves of increasing size, and of a still larger 3rd-wave uptrend that began on February 21. That larger 3rd wave will be followed by a 4th-wave downward correction quite a bit larger than the one we’re seeing now.
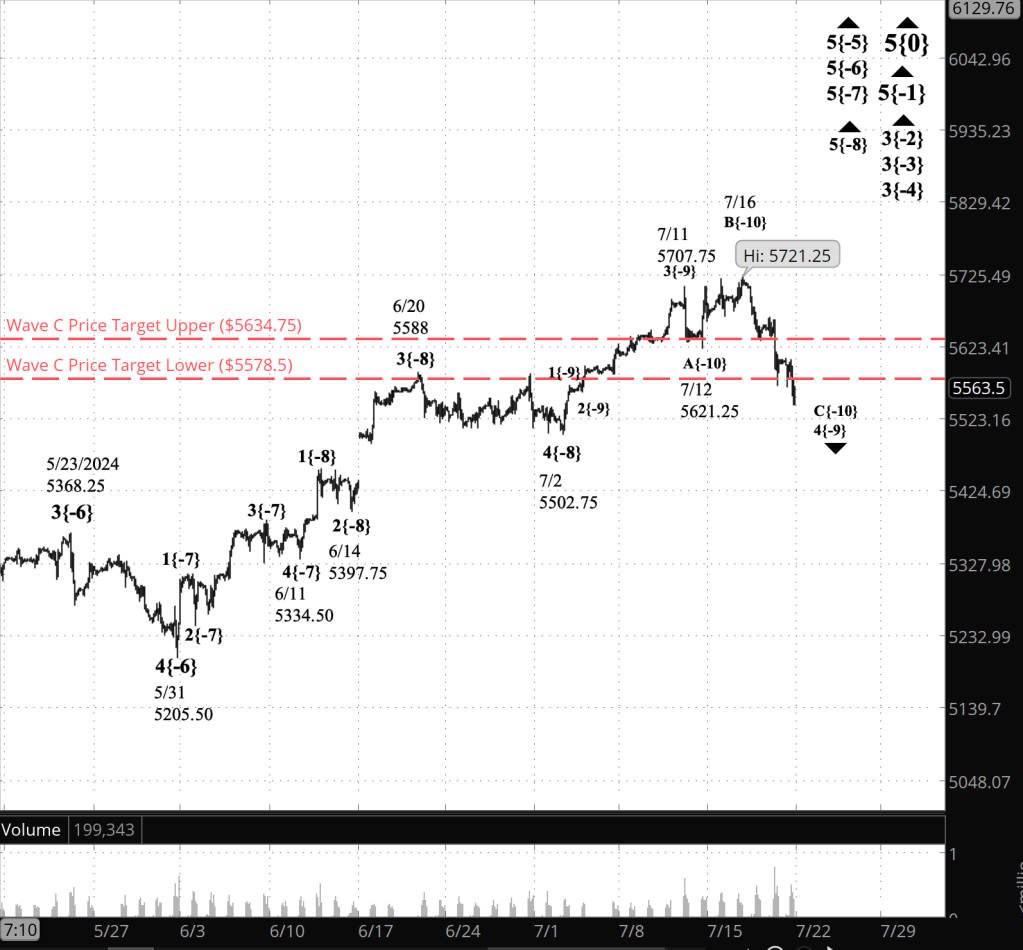
[S&P 500 E-mini futures at 3:30 p.m., 110-minute bars, with volume]
What are the alternatives? There may be a 1st wave on the chart, between wave 5{-6} and 5{-5}. If that’s the proper count, then it would delay the onset or the 4th-wave downward correction, wave 4{-4}. See the June 18 Trader’s Notebook for a more detailed discussion.
What does Elliott wave theory say? Here are the waves that underly the analyses.
Principal Analysis:
- Rising wave 5{0} is underway. It is a wave of Intermediate degree that began in December 2018.
- It is in its final subwave, wave 5{-1}.
- Within wave 5{-1}, rising waves 3{-2}, 3{-3} and 3{-4} are underway, as is wave 5{-5}.
- Wave 5{-6} is underway and is in its final subwave, uptrending wave 5{-7}, which in turn is in its final subwave, uptrending wave 5{-8}.
- Within wave 5{-8}, a downward correction, wave 4{-9}, is in progress.
- Wave 4{-9} is in its final subwave, wave C{-10}
Reading the chart. Price movements — waves – – in Elliott wave analysis are labeled with numbers within trending waves and letters with corrective waves. The subscripts — numbers in curly brackets — designate the wave’s degree, which, in Elliott wave analysis, means the relative position of a wave within the larger and smaller structures that make up the chart. R.N. Elliott, who in the 1930s developed the form of analysis that bears his name, viewed the chart as a complex structure of smaller waves nested within larger waves, which in turn are nested within still larger waves. In mathematics it’s called a fractal structure, where at every scale the pattern is similar to the others.
Learning and other resources. Elliott wave analysis provides context, not prophecy. As the 20th century semanticist Alfred Korzybski put it in his book Science and Sanity (1933), “The map is not the territory … The only usefulness of a map depends on similarity of structure between the empirical world and the map.” And I would add, in the ever-changing markets, we can judge that similarity of structure only after the fact.
See the menu page Analytical Methods for a rundown on where to go for information on Elliott wave analysis.
By Tim Bovee, Portland, Oregon, July 19, 2024
Disclaimer
Tim Bovee, Private Trader tracks the analysis and trades of a private trader for his own accounts. Nothing in this blog constitutes a recommendation to buy or sell stocks, options or any other financial instrument. The only purpose of this blog is to provide education and entertainment.
No trader is ever 100 percent successful in his or her trades. Trading in the stock and option markets is risky and uncertain. Each trader must make trading decisions for his or her own account, and take responsibility for the consequences.
License
All content on Tim Bovee, Private Trader by Timothy K. Bovee is licensed under a Creative Commons Attribution-ShareAlike 4.0 International License.
Based on a work at www.timbovee.com.

You must be logged in to post a comment.