3:30 p.m. New York time
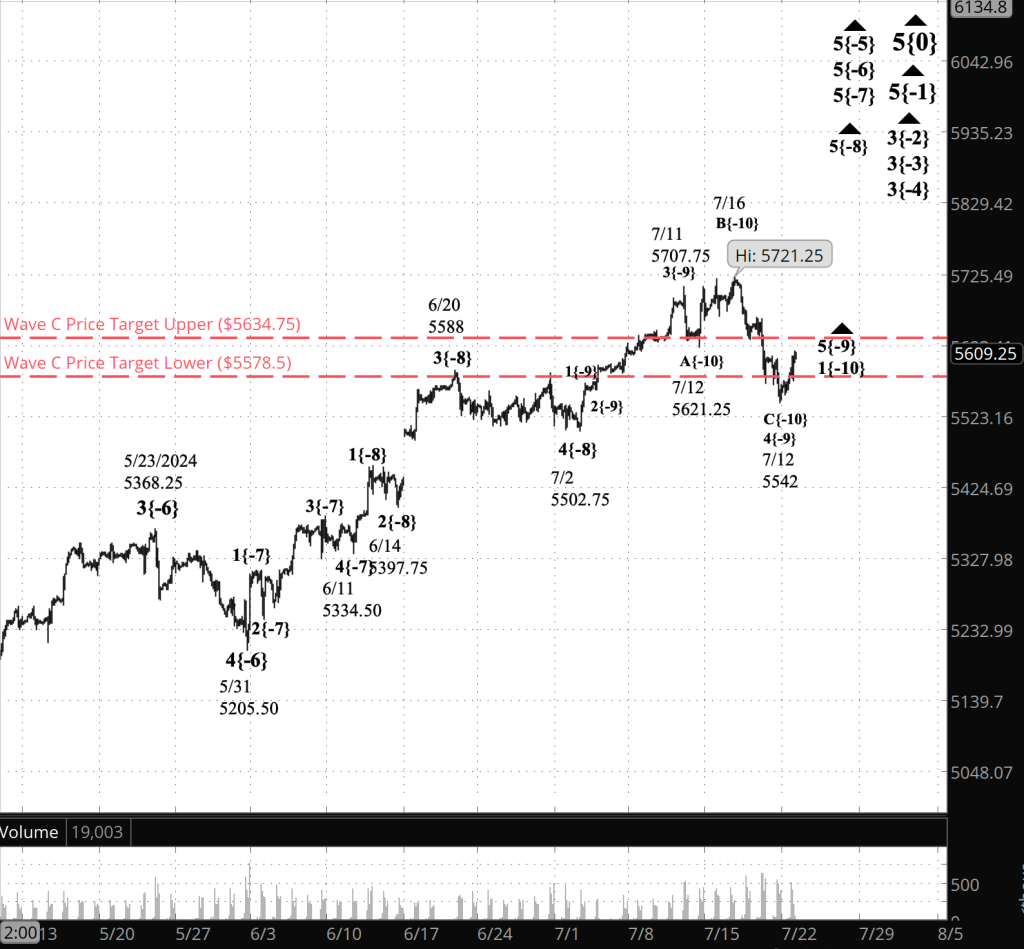
Half an hour before the closing bell. The S&P 500 futures rose during the session into the 5610s. The movement is consistent with this morning’s Elliott Wave Theory principal analysis: The 4th-wave downward correction that began on July 11 ended on July 19 and a the initial subwave of a 5th-wave uptrend has begun.
I’ve updated the chart.
9:35 a.m. New York time
What’s happening now? The S&P 500 E-mini futures rose after trading resumed overnight, from the 5950s into the 5590s.
What does it mean? Seen through the lens of Elliott Wave Theory, the best analysis of the chart, in my opinion, is that the low of July 19 was the end of the 4th-wave downward correction that began on July 11, and the beginning of an uptrendng 5th wave.
Unsurprisingly, there is an alternative analysis, which sees the July 19 low as a smaller subwave within the C wave, the final subwave of the 4th-wave correction. More on that below.
The 5th wave began from 5542, slightly below the price target range of the preceding 4th wave. The rise that began from that point is taking the form of a trend (rather than a correction). The upper and lower boundaries of the price target range are marked on the chart with red dashed lines.
The wave labels on the chart show the wave number and a subscript showing the wave’s distance from the Intermediate degree within the fractal structure of the chart. The 4th wave that ended on July 19 is wave 4{-9} and the 5th wave that followed is wave 5{-9}.
Looking ahead.The present Intermediate-degree wave is wave 5{0}, which began on December 26, 2018, from the 2340s. So the correction just ended and the 5th wave just begun are small movements within a complex, much larger structure of waves within waves.
The main question for traders is how are far will wave 5{-9} travel. Fifth waves usually move beyond the end of the preceding 3rd wave of the same degree. Wave 3{-9} ended at 5707.75 on July 11. That means that if typical, this 5th wave will rise by at least 179.25 points, or 3.2% from its July 19 starting point.
Sometimes 5th wave fall short of that goal, a condition known as “truncation” among Ellioticians. Usually it move farther, and sometimes much farther in a condition known as extension.
Which variety this 5th wave is, only time will tell.
Big picture. This 5th wave is relatively small, but it will have a large impact. This is a scenario that I’ve described several times, and it bear repeating.
The end of the wave 5{-9} will also be the end of four nested 5th waves of increasing degree, wave 5{-8}, 5{-7}, 5{-6} and 5{-5}. They are all subwaves of wave 3{-4}, one degree higher, which will also end along with those 5th waves.
With 3{-4}, a 4th-wave downward correction, wave 4{-4}, will begin. Wave 3{-4} began on February 21 from 4959, and the 4th-wave correction will be of a similar magnitude. It will, for traders unfamiliar with Elliott Wave Theory, be an OMG! moment.
[S&P 500 E-mini futures at 3:30 p.m., 2-hour bars, with volume]
What are the alternatives? If wave C within the 4th-wave correction is not over, then it is in its 4th of five subwaves, giving the downward correction a bit more time to play through its endgame.
What does Elliott wave theory say? Here are the waves that underly the analyses.
Principal Analysis:
- Rising wave 5{0} is underway. It is a wave of Intermediate degree that began in December 2018.
- It is in its final subwave, wave 5{-1}.
- Within wave 5{-1}, rising waves 3{-2}, 3{-3} and 3{-4} are underway, as is wave 5{-5}.
- Wave 5{-6} is underway and is in its final subwave, uptrending wave 5{-7}, which in turn is in its final subwave, uptrending wave 5{-8}.
- Within wave 5{-8}, uptrendng wave 5{-9}, is in progress.
- Wave 5{-9} is in its initial subwave, wave 1{-10}.
Alternative Analysis:
- Within wave 5{-8}, downward correction wave 4{-9}, is in progress.
- Wave 4{-9} is in its final subwave, wave C{-10}
.Reading the chart. Price movements — waves – – in Elliott wave analysis are labeled with numbers within trending waves and letters with corrective waves. The subscripts — numbers in curly brackets — designate the wave’s degree, which, in Elliott wave analysis, means the relative position of a wave within the larger and smaller structures that make up the chart. R.N. Elliott, who in the 1930s developed the form of analysis that bears his name, viewed the chart as a complex structure of smaller waves nested within larger waves, which in turn are nested within still larger waves. In mathematics it’s called a fractal structure, where at every scale the pattern is similar to the others.
Learning and other resources. Elliott wave analysis provides context, not prophecy. As the 20th century semanticist Alfred Korzybski put it in his book Science and Sanity (1933), “The map is not the territory … The only usefulness of a map depends on similarity of structure between the empirical world and the map.” And I would add, in the ever-changing markets, we can judge that similarity of structure only after the fact.
See the menu page Analytical Methods for a rundown on where to go for information on Elliott wave analysis.
By Tim Bovee, Portland, Oregon, July 22, 2024
Disclaimer
Tim Bovee, Private Trader tracks the analysis and trades of a private trader for his own accounts. Nothing in this blog constitutes a recommendation to buy or sell stocks, options or any other financial instrument. The only purpose of this blog is to provide education and entertainment.
No trader is ever 100 percent successful in his or her trades. Trading in the stock and option markets is risky and uncertain. Each trader must make trading decisions for his or her own account, and take responsibility for the consequences.
License
All content on Tim Bovee, Private Trader by Timothy K. Bovee is licensed under a Creative Commons Attribution-ShareAlike 4.0 International License.
Based on a work at www.timbovee.com.

You must be logged in to post a comment.