3:30 p.m. New York time
Half an hour before the closing bell. The S&P 500 futures rose throughout the session, reaching into the 5580s after the Federal Open Market Committee left the Federal Funds Rate unchanged.
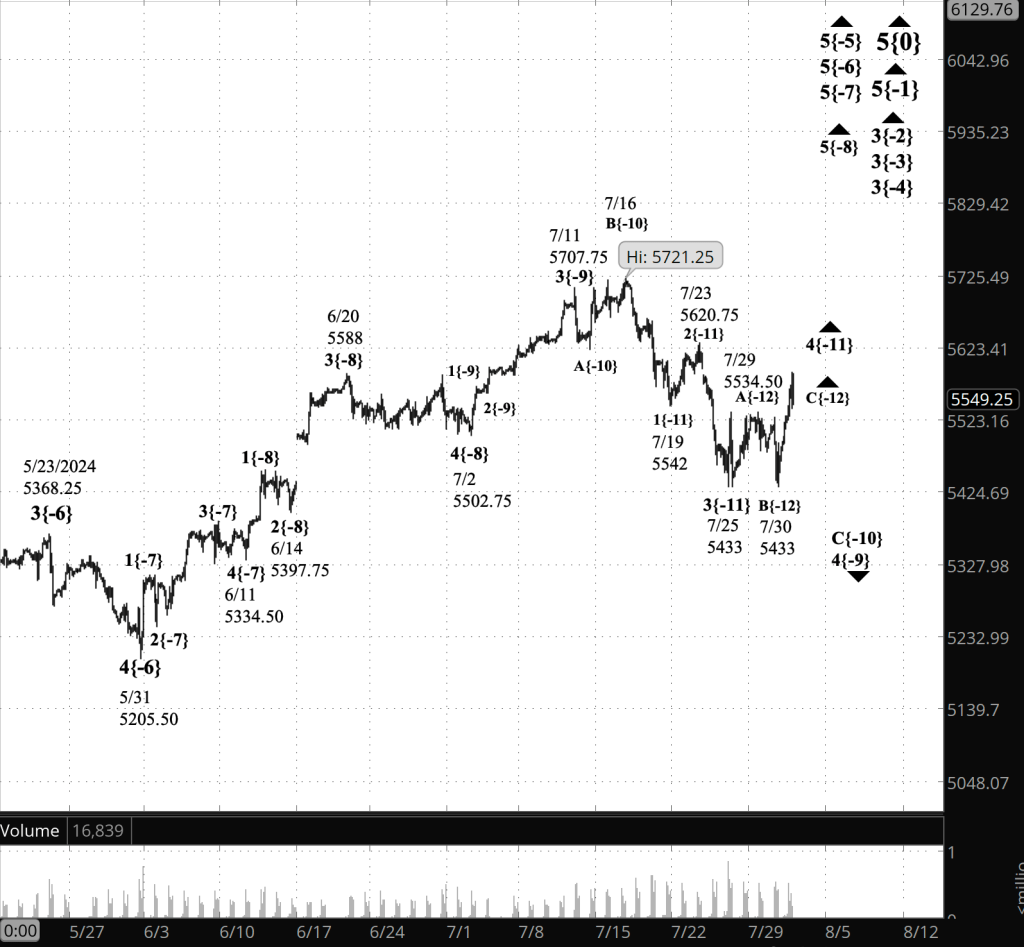
The final subwave of the low-degree upward correction that began on February 25 continues.
9:35 a.m. New York time
What’s happening now? The S&P 500 E-mini futures rose overnight into the 5540s.
What does it mean? Elliott Wave Theory analysis concludes that the 4th-wave upward correction that began on July 25 has progressed to its final subwave, rising wave C. The rise has carried the price beyond the endpoint of the preceding A wave, which lends weight to the conclusion that wave C is underway.
All of this is happening within the 4th-wave upward correction that began on July 25 from 5433, which is a subwave of a larger C wave within a larger 4th-wave downward correction.
On the chart I mark the degree of a wave within the fractal structure of the chart with a subscript in curly brackets, denoting the wave’s distance from Intermediate degree. The present Intermediate wave is wave 5{0}, which began in December 2018.
The present wave is rising C{-12} within rising wave 4{-11} within falling wave C{-10) within falling wave 4{-9}.
Long story short, under the principal analysis, the 4th-wave upward correction that began on July 25 is close to its end.
What’s next? The end of the smaller C wave will also be the end of the small 4th-wave upward correction, as well as of the larger C wave within a 4th-wave downward correction that began on July 11.
That larger wave 4 will be followed by an uptrending 5th-wave, the final subwave within a still larger 5th wave that began on July 2, nested within three additional subwaves, each a larger degree than the one before it. The end of those 5th waves will also be the end of a still larger 3rd wave that encompasses them all, wave 3{-4} on the chart, which began on February 21 from 4959.
That large 3rd wave will be followed by an appropriately large 4th-wave downward correction that will take months to retrace a portion of the 3rd-wave’s rise.
[S&P 500 E-mini futures at 3:30 p.m., 2-hour bars, with volume]
What are the alternatives? On the chart the 3rd wave that preceded the present rather small correction ended on July 11. There’s a case to be made that it actually ended on July 16, and if that’s the case, then the present correction is in its 1st subwave, wave A, with two more subwaves to follow.
What does Elliott wave theory say? Here are the waves that underly the analyses.
Principal Analysis:
.Rising wave 5{0} is underway. It is a wave of Intermediate degree that began in December 2018.
It is in its final subwave, wave 5{-1}.
Within wave 5{-1}, rising waves 3{-2}, 3{-3} and 3{-4} are underway, as is wave 5{-5}.
Wave 5{-6} is underway and is in its final subwave, uptrending wave 5{-7}, which in turn is in its final subwave, uptrending wave 5{-8}.
Within wave 5{-8}, wave 4{-9}, a downward correction, is in progress.
Wave 4{-9} is in its final subwave, wave C{-10}.
Within wave C{-10}, wave 4{-11} is underway and is in its final subwave, wave 5{-12}
Reading the chart. Price movements — waves – – in Elliott wave analysis are labeled with numbers within trending waves and letters with corrective waves. The subscripts — numbers in curly brackets — designate the wave’s degree, which, in Elliott wave analysis, means the relative position of a wave within the larger and smaller structures that make up the chart. R.N. Elliott, who in the 1930s developed the form of analysis that bears his name, viewed the chart as a complex structure of smaller waves nested within larger waves, which in turn are nested within still larger waves. In mathematics it’s called a fractal structure, where at every scale the pattern is similar to the others.
Learning and other resources. Elliott wave analysis provides context, not prophecy. As the 20th century semanticist Alfred Korzybski put it in his book Science and Sanity (1933), “The map is not the territory … The only usefulness of a map depends on similarity of structure between the empirical world and the map.” And I would add, in the ever-changing markets, we can judge that similarity of structure only after the fact.
See the menu page Analytical Methods for a rundown on where to go for information on Elliott wave analysis.
By Tim Bovee, Portland, Oregon, July 31, 2024
Disclaimer
Tim Bovee, Private Trader tracks the analysis and trades of a private trader for his own accounts. Nothing in this blog constitutes a recommendation to buy or sell stocks, options or any other financial instrument. The only purpose of this blog is to provide education and entertainment.
No trader is ever 100 percent successful in his or her trades. Trading in the stock and option markets is risky and uncertain. Each trader must make trading decisions for his or her own account, and take responsibility for the consequences.
License
All content on Tim Bovee, Private Trader by Timothy K. Bovee is licensed under a Creative Commons Attribution-ShareAlike 4.0 International License.
Based on a work at www.timbovee.com.

You must be logged in to post a comment.