3:30 p.m. New York time
Half an hour before the closing bell. The S&P 500 futures reached its low so far today, 5120, two minutes into the session, and then rose, coming close to 5280.
Elliott Wave Theory: The decline that began on August 1 continues. It is now working through the downtrending 5th wave, the final wave of the correction’s final subwave, wave C, within the 4th-wave correction that began on July 11.
9:35 a.m. New York time
What’s happening now? The S&P 500 E-mini futures continued to fall overnight, reaching 5120 as the opening bell approached.
What does it mean? Although the focus in the news stories has been on Friday’s rapid decline — on August 4 — Elliott Wave Theory analysis the sees the present declining wave as having begun on August 1. That wave is the 5th and final wave of wave C, the final wave of a 4th-wave downward correction that began on July 11.
So although much of the market commentary has gone into full panic mode in the last day, the 4th-wave correction has been with us for a bit more than three weeks.
The end of the world as we know it? Hardly. The S&P 500 futures’ all-time high occurred on July 16 at 5721.75, a B-wave overshoot within the correction from July 11. The total decline so far has covered a bit more than 600 points, peak to low, about 10.5%. It has covered 20 days, the decline-per-day on average has been 30 points, or 0.6% of the overnight low.
That sort of fluctuation happens every day, throughout the day.
What’s next? When the present 5th-wave decline is complete, it will also be the end of the parent wave C within the 4th-wave downward correction that began on July 11. A 5th-wave uptrend will following, carrying the price higher, most likely above the all-time high set on July 16. Fifth-waves can be flaky, so there’s no guarantee that it won’t fall short.
The Chart. I’ve moved the chart in for a close-up of the 4th-wave downward correction from July 11. For a broader view see Friday’s “Trader’s Notebook”.
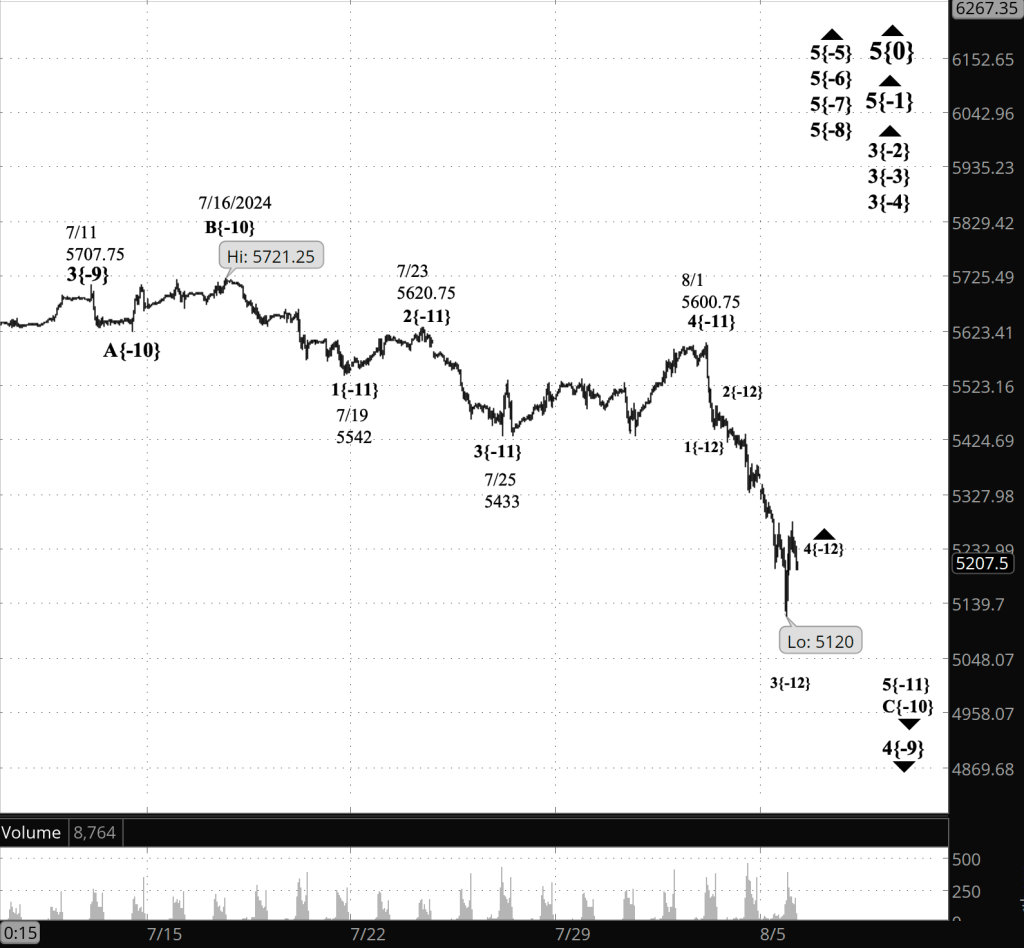
[S&P 500 E-mini futures at 3:30 p.m., 45-minute bars, with volume]
What are the alternatives? To be determined.
What does Elliott wave theory say? Here are the waves that underly the analyses.
Principal Analysis:
- Rising wave 5{0} is underway. It is a wave of Intermediate degree that began in December 2018.
- It is in its final subwave, wave 5{-1}.
- Within wave 5{-1}, rising waves 3{-2}, 3{-3} and 3{-4} are underway, as is wave 5{-5}.
- Wave 5{-6} is underway and is in its final subwave, uptrending wave 5{-7}, which in turn is in its final subwave, uptrending wave 5{-8}.
- Within wave 5{-8}, wave 4{-9}, a downward correction, is in progress.
- Wave 4{-9} is in its final subwave, wave C{-10}.
- Wave C{-10} is in its final subwave, wave 5{-11}.
- At the lowest level analyzed, declining wave 3{-12} is underway — maybe. There’s a lack of clairity in some parts of the decline, as is often the case with fast movements.
Reading the chart. Price movements — waves – – in Elliott wave analysis are labeled with numbers within trending waves and letters with corrective waves. The subscripts — numbers in curly brackets — designate the wave’s degree, which, in Elliott wave analysis, means the relative position of a wave within the larger and smaller structures that make up the chart. R.N. Elliott, who in the 1930s developed the form of analysis that bears his name, viewed the chart as a complex structure of smaller waves nested within larger waves, which in turn are nested within still larger waves. In mathematics it’s called a fractal structure, where at every scale the pattern is similar to the others.
Learning and other resources. Elliott wave analysis provides context, not prophecy. As the 20th century semanticist Alfred Korzybski put it in his book Science and Sanity (1933), “The map is not the territory … The only usefulness of a map depends on similarity of structure between the empirical world and the map.” And I would add, in the ever-changing markets, we can judge that similarity of structure only after the fact.
See the menu page Analytical Methods for a rundown on where to go for information on Elliott wave analysis.
By Tim Bovee, Portland, Oregon, August 5, 2024
Disclaimer
Tim Bovee, Private Trader tracks the analysis and trades of a private trader for his own accounts. Nothing in this blog constitutes a recommendation to buy or sell stocks, options or any other financial instrument. The only purpose of this blog is to provide education and entertainment.
No trader is ever 100 percent successful in his or her trades. Trading in the stock and option markets is risky and uncertain. Each trader must make trading decisions for his or her own account, and take responsibility for the consequences.
License
All content on Tim Bovee, Private Trader by Timothy K. Bovee is licensed under a Creative Commons Attribution-ShareAlike 4.0 International License.
Based on a work at www.timbovee.com.

You must be logged in to post a comment.