3:30 p.m. New York time
Half an hour before the closing bell.The S&P 500 futures declined during the session, returning to the 5230s. The lower the decline, the greater the support it lends to the alternative analysis, which says that that the low-grade 4th-wave upward correction that began on August 5 ended at the overnight high, 5342, and a downtrending 5th wave has begun.
However, I’m not yet persuaded, and for now I’m leaving the chart as it was, reflecting this morning’s principal analysis, which says that the 4th-wave upward correction continues.
9:35 a.m. New York time
What’s happening now? The S&P 500 E-mini futures rose overnight, reaching into the 5330s. The price approached but remained below the August 6 session high, 5342.
What does it mean? After applying Elliott Wave Theory to the chart, I’ve concluded that the low-degree 4th-wave upward correction that began on August 5 is still underway.
Any move of the price above the August 6 session high creates the possibility that the 4th-wave has ended and an uptrending 5th wave of the same degree has begun. See “What are the alternatives”, below, for more.e
Waves within waves. The correction is part of of the end game of a larger downtrending 5th wave that began on August 1, the final wave of a declining C-wave, which is the final wave of a larger 4th-wave downward correction that began on July 11.
That C wave has carried the price, so far, from the July 16 all time high, 5721.25, down to the August 5 low, 5120.
On a larger scale. The end of the 4th-wave downward correction from July 11 will be followed by a 5th-wave uptrend of roughly similar scale. When that 5th-wave is complete, it will also be the end of a series of four nested 5th waves, each larger than the one before it, and of the still larger 3rd wave that encompasses them, which began on February 21 from 4959
A similarly larger 4th-wave downward correction will then begin and will be on a sale similar to the preceding 3rd wave. Switching to wise-guy talk: If you think Friday’s steep decline was big, you ain’t seen nothing yet. Just wait for this future 4th wave.
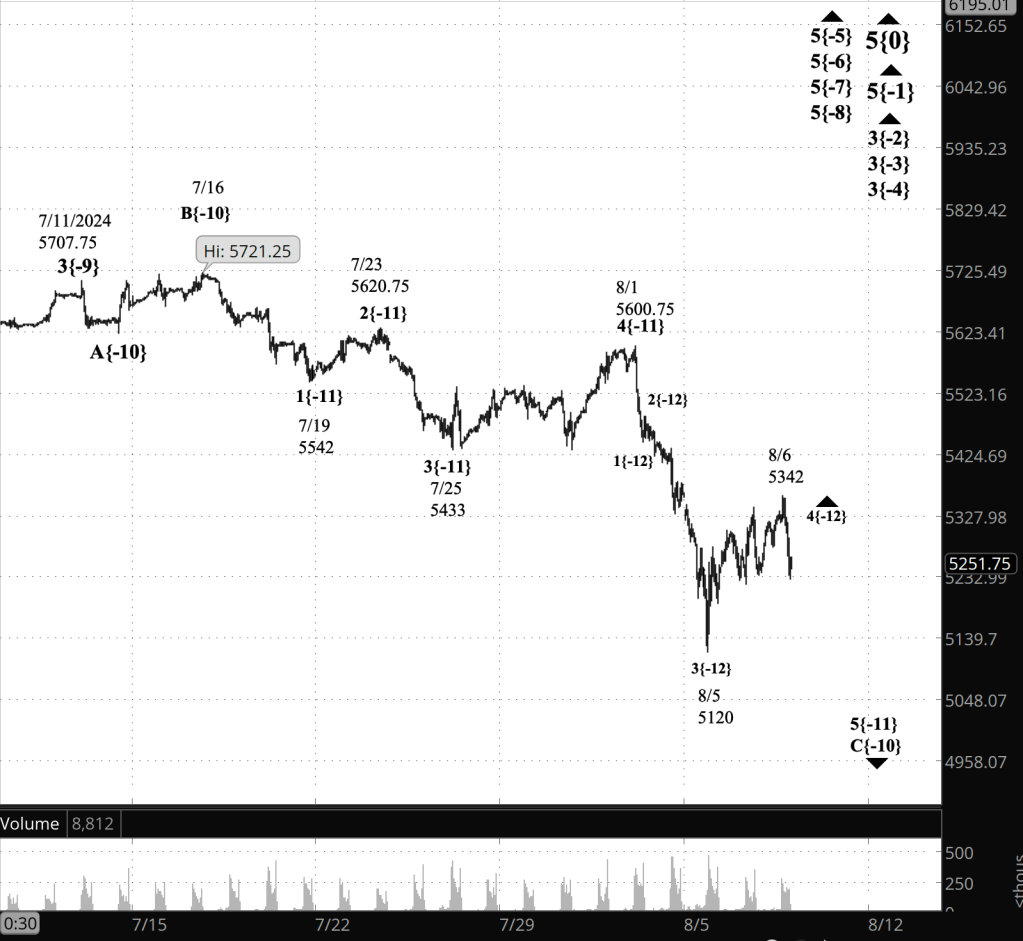
[S&P 500 E-mini futures at 3:30 p.m., 50-minute bars, with volume]
What are the alternatives? It’s possible that the August 6 session high is the end of the low 4th-wave correction. If so, then the 5th-wave uptrend that follows will likely carry the price back into the 5600s, although it could fall short or it could go much higher.
What does Elliott wave theory say? Here are the waves that underly the analyses.
Principal Analysis:
- Rising wave 5{0} is underway. It is a wave of Intermediate degree that began in December 2018.
- It is in its final subwave, wave 5{-1}.
- Within wave 5{-1}, rising waves 3{-2}, 3{-3} and 3{-4} are underway, as is wave 5{-5}.
- Wave 5{-6} is underway and is in its final subwave, uptrending wave 5{-7}, which in turn is in its final subwave, uptrending wave 5{-8}.
- Within wave 5{-8}, wave 4{-9}, a downward correction, is in progress.
- Wave 4{-9} is in its final subwave, wave C{-10}.
- Wave C{-10} is in its final subwave, wave 5{-11}.
- At the lowest level analyzed, rising wave 4{-12} is underway.
Reading the chart. Price movements — waves – – in Elliott wave analysis are labeled with numbers within trending waves and letters with corrective waves. The subscripts — numbers in curly brackets — designate the wave’s degree, which, in Elliott wave analysis, means the relative position of a wave within the larger and smaller structures that make up the chart. R.N. Elliott, who in the 1930s developed the form of analysis that bears his name, viewed the chart as a complex structure of smaller waves nested within larger waves, which in turn are nested within still larger waves. In mathematics it’s called a fractal structure, where at every scale the pattern is similar to the others.
Learning and other resources. Elliott wave analysis provides context, not prophecy. As the 20th century semanticist Alfred Korzybski put it in his book Science and Sanity (1933), “The map is not the territory … The only usefulness of a map depends on similarity of structure between the empirical world and the map.” And I would add, in the ever-changing markets, we can judge that similarity of structure only after the fact.
See the menu page Analytical Methods for a rundown on where to go for information on Elliott wave analysis.
By Tim Bovee, Portland, Oregon, August 7, 2024
Disclaimer
Tim Bovee, Private Trader tracks the analysis and trades of a private trader for his own accounts. Nothing in this blog constitutes a recommendation to buy or sell stocks, options or any other financial instrument. The only purpose of this blog is to provide education and entertainment.
No trader is ever 100 percent successful in his or her trades. Trading in the stock and option markets is risky and uncertain. Each trader must make trading decisions for his or her own account, and take responsibility for the consequences.
License
All content on Tim Bovee, Private Trader by Timothy K. Bovee is licensed under a Creative Commons Attribution-ShareAlike 4.0 International License.
Based on a work at www.timbovee.com.

You must be logged in to post a comment.