3:30 p.m. New York time
Half an hour before the closing bell. The S&P 500 futures reached a high in the 5390s during the session and then withdrew, so far reaching the 5350s. This morning’s Elliott Wave Theory analysis stands unchanged. The final subwave, wave C, of the 4th wave upward correction that began on August 5 continues to work through its endgame.
9:35 a.m. New York time
What’s happening now? The S&P 500 E-mini futures crept higher after trading resumed overnight, from the 5350s to the 5380s.
What does it mean? Elliott Wave Theory analysis sees the movement as follows: The final subwave of a low-degree 4th-wave upward correction continues. The 4th wave began on August 5 and the final subwave, wave C, on August 7.
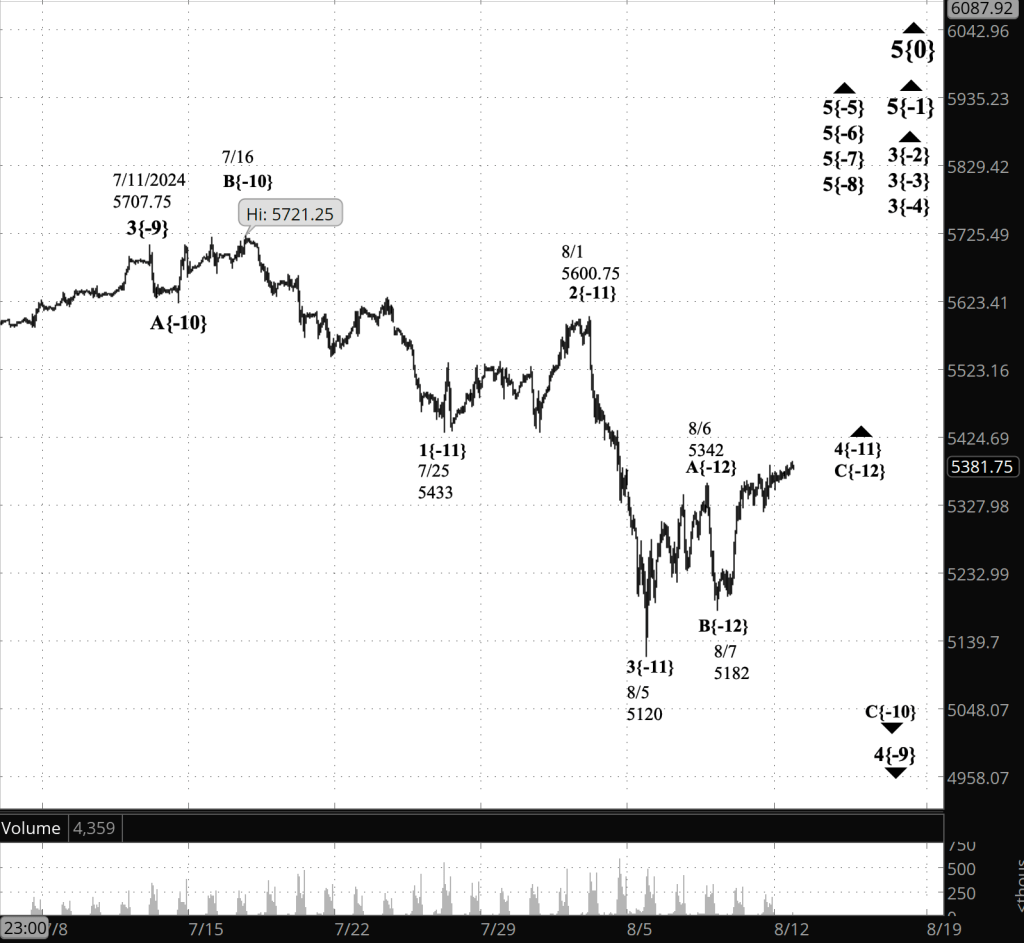
When wave C is complete, it will be the end of the parent 4th wave and the beginning of a 5th-wave downtrend that will most likely carry the pride below 5120 — the end of the preceding 3rd wave — and perhaps significantly below that level. Occasionally, 5th waves are truncated, and if that’s the case with this wave, then it will end somewhere above 5120.
The waves are labeled on the chart with the wave number and a subscript in curly brackets showing the degree’s distance from Intermediate degree. The present Intermediate degree wave, labeled 5{0}, began in December 2018.
The 4th-wave downward correction is labeled 4{-11} and its final subwave, wave C{-12}. The future 5th wave is wave 5{-12}.
After the 5th. Those waves are all part of the final subwave, wave C, of a larger 4th-wave downward correction that began on July 11 — wave C{-10} within wave 4{-9} on the chart.
The end of that larger 4th wave will be followed by a rising 5th wave that will carry the price above 5707.75, and perhaps significantly above that level. Unless, of course, the 5th wave truncates — comes up short — as some 5th waves do. The rising 5th wave is labeled wave 5{-9} on the chart.
The end of that 5th wave will be like a bowling ball hitting the pins. The event will be the end of a series of four 5th waves, each “pin” falling against a 5th-wave one-degree higher, in a series of endings. The four 5th waves, on the chart, are labeled waves 5{-8}, 5{-7}, 5{-6} and 5{-5}.
Above them all is a rising 3rd wave — wave 3{-4} on the chart — which began on February 21 from 4959. The 4th-wave downward correction that follows — wave 4{-4} — will be of significant size and duration.
[S&P 500 E-mini futures at 3:30 p.m., hourly bars, with volume]
What are the alternatives? We’re at a point where the present low-degree C wave — wave C{-12} — is routinely reaching new highs, and in high carries the possibility that it is the end of wave C and of its parent 4th wave. Only the price movements that follow each high can tell us whether wave C has in fact ended. It’s an example of the ambiguity that is part of Elliott Wave Theory.
What does Elliott wave theory say? Here are the waves that underly the analyses.
Principal Analysis:
- Rising wave 5{0} is underway. It is a wave of Intermediate degree that began in December 2018.
- It is in its final subwave, wave 5{-1}.
- Within wave 5{-1}, rising waves 3{-2}, 3{-3} and 3{-4} are underway, as is wave 5{-5}.
- Wave 5{-6} is underway and is in its final subwave, uptrending wave 5{-7}, which in turn is in its final subwave, uptrending wave 5{-8}.
- Within wave 5{-8}, wave 4{-9}, a downward correction, is in progress.
- Wave 4{-9} is in its final subwave, wave C{-10}.
- Wave C{-10} is in its next-to-the-last subwave, wave 4{-11}, which in turn is in its final subwave, wave C{-12}.
Reading the chart. Price movements — waves – – in Elliott wave analysis are labeled with numbers within trending waves and letters with corrective waves. The subscripts — numbers in curly brackets — designate the wave’s degree, which, in Elliott wave analysis, means the relative position of a wave within the larger and smaller structures that make up the chart. R.N. Elliott, who in the 1930s developed the form of analysis that bears his name, viewed the chart as a complex structure of smaller waves nested within larger waves, which in turn are nested within still larger waves. In mathematics it’s called a fractal structure, where at every scale the pattern is similar to the others.
Learning and other resources. Elliott wave analysis provides context, not prophecy. As the 20th century semanticist Alfred Korzybski put it in his book Science and Sanity (1933), “The map is not the territory … The only usefulness of a map depends on similarity of structure between the empirical world and the map.” And I would add, in the ever-changing markets, we can judge that similarity of structure only after the fact.
See the menu page Analytical Methods for a rundown on where to go for information on Elliott wave analysis.
By Tim Bovee, Portland, Oregon, August 12, 2024
Disclaimer
Tim Bovee, Private Trader tracks the analysis and trades of a private trader for his own accounts. Nothing in this blog constitutes a recommendation to buy or sell stocks, options or any other financial instrument. The only purpose of this blog is to provide education and entertainment.
No trader is ever 100 percent successful in his or her trades. Trading in the stock and option markets is risky and uncertain. Each trader must make trading decisions for his or her own account, and take responsibility for the consequences.
License
All content on Tim Bovee, Private Trader by Timothy K. Bovee is licensed under a Creative Commons Attribution-ShareAlike 4.0 International License.
Based on a work at www.timbovee.com.

You must be logged in to post a comment.