3:30 p.m. New York time
Half an hour before the closing bell. The S&P 500 futures rose during the session, reaching into the 5620s. Elliott Wave Theory: The 5th-wave uptrend that began on August 5 continues and is in its 3rd subwave.
How small are the waves? It’s possible that what I’ve abled as wave 3{-6} is actually wave 1{-6} and it’s in its 3rd subwave, wave 1{-7}.
12:35 a.m. New York time
Elliott Wave Theory rule broken. Shortly after 11 a.m. the S&P 500, index and futures saw the rising 4th-wave on their respective charts move beyond the end of the preceding 1st wave, thereby breaking a firm rule of Elliott Wave Analysis and invalidating this morning’s analysis.
One of the strong points of Elliott Wave Theory is that when the map no longer matches the territory — when the analysis no longer matches the reality of the chart — the situation and the reason is perfectly clear, and the map must be redrawn in order to have a valid analysis.
Compare that to any number of technical analysis tools, where when the predicted uptrend quickly turns into a downtrend, the only clarity is for the trader to nod wisely and mutter, “Ah, a whipsaw”.
A new analysis. To make a new analysis that stayed in compliance with the rules of Elliott Wave Theory, I reworked the analysis from the start of rising wave 3 on February 21. The goal of the relabelling was to ensure that the rise that began on August 5 wasn’t a 4th wave, and so wouldn’t break the rule that invalidated the prior analysis.
Under the new principal analysis, the present rise from August 5 is an uptrending 5th wave that is in its middle subwave, wave 3.
The chart labels are a wave number followed by a subscript in curly brackets showing how many degrees (or levels) the wave is from Intermediate degree. The present Intermediate degree is wave 5{0}. The uptrending 5th wave now underway is wave 5{-5}, and its current subwave is wave 3{-6}.
All of this is happening within a series of 5th waves covering five degrees in the fractal structure. When the present wave 5{-5} is complete, it will cascade up the structure and simultaneously trigger the end of those five larger degrees: waves 5{-4}, 5{-3}, 5{-2}, 5{-1} and the Intermediate degree, wave 5{0}, which began in December 2018.
Moreover, there are three larger 5th waves above wave 5{0}. They will also be triggered by the end of wave 5{-5}. From smaller to larger, they are wave 5{+1}, Primary degree, which began in March 2009, wave 5{+2}, Cycle degree, which began in December 1974, and wave 5{+3}, Supercycle degree, which began in July 1932. Not a typo. The present Supercycle degree wave began in the Great Depression of the 1930s the year before Franklin D. Roosevelt took the oath of office as president.
Is this nuts? All of that seems a bit crazy, but has been baked into the fractal model of Elliott Wave Theory from its development by R.N. Elliott in the 1930s. A look at any chart — long term or short — clearly shows that larger waves have smaller subwaves, which in turn has subwaves that are smaller still.
And so it goes, from the smallest level to the largest. Elliott Wave Theory, by recognizing this complexity rather than seeing the chart as merely a squiggly line, makes it possible for us to do an analysis wherein a relatively small 5th wave ends and in so doing, triggers the end of a 5th wave eight degrees higher whose begining was eight years ago.
Out of caution, I intend to spend this week working with very long charts to ensure that this underlying structure of this analysis is valid, and shall report any findings here in Trader’s Notebook.
9:35 a.m. New York time
What’s happening now? The S&P 500 E-mini futures set a new high on Friday, 5593.75, half an hour before the closing bell. When trading resumed overnight the price pulled back slightly, into the 5560s, before rersing slightly.
What does it mean? Friday’s high is important because of a rule of Elliott Wave Theory. Applied to the chart, it goes like this:
- A 4th-wave upward correction began on August 5th and is still underway.
- The preceding 1st wave ended on April 1 at 3600.75.
- A 4th wave can never move beyond the end of the preceding 3rd wave.
- Friday’s high is fewer than 10 points away of breaking that rule.
If the price does move above 3600.75, then the analysis no longer matches the reality of the chart and will be revised. Maybe. The S&P 500 futures are one of many products tied to the S&P 500 index. The futures move in 25-cent increments, the index in 1-cent increments. If the futures move above the end of wave 1 but the index does not, then perhaps it’s a case of rounding error. After all, which S&P 500 product set sets the standard? The futures, the SPY ETF, or the S&P 500 the index itself. I tend to give greatest credence to the index, but when there’s a divergence, I look hard at the problem to see if that approach is wrong.
On the index, Friday’s peak was 5554.25 and wave 1 ended on August 1 at 5566.16. If the index moves above 5554.25, then it has validated a rule of Elliott Wave Theory and there is no ambiguity about the analysis requiring revisions.
I’ve simplified the Fibonacci retracement ladder, in red, that appeared on earlier futures charts to show the 100% retracement: 5600.75, beyond which the 4th-wave cannot rise, and the top two Fibonacci retracement levels: 78.6% and 61.8%.
See the “What does it mean?” section in Friday’s Trader’s Notebook for a discussion of what happens after wave 4 ends.
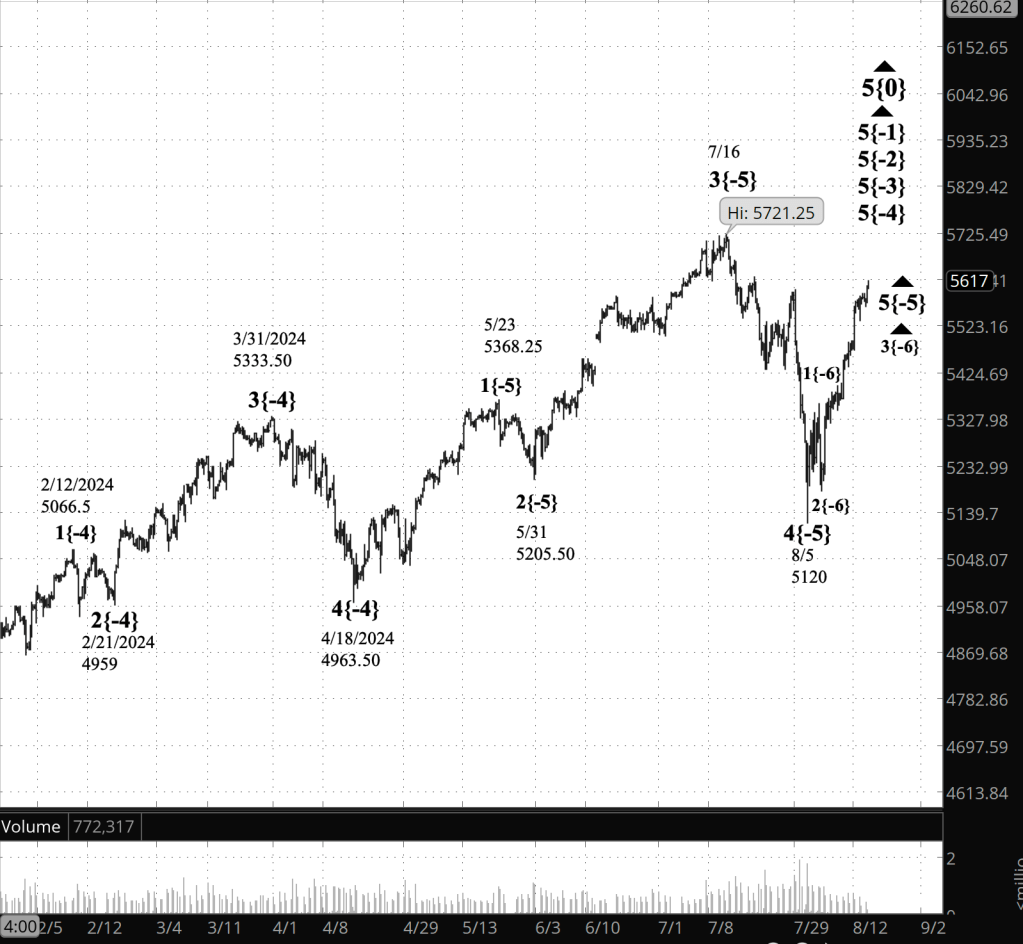
[S&P 500 E-mini futures at 3:30 p.m., 360-minute bars, with volume]
What does Elliott wave theory say? Here are the waves that underly the analyses.
Principal Analysis:
[I have redone this to conform to the new analysis.]
- Rising wave 5{0} is underway. It is a wave of Intermediate degree that began in December 2018.
- It is in its final subwave, wave 5{-1}.
- Within wave 5{-1}, rising waves 5{-2}, 5{-3} and 5{-4} are underway, as is wave 5{-5}.
- Wave 5{-5} is in its middle subwave, wave 3{-6}.
Reading the chart. Price movements — waves – – in Elliott wave analysis are labeled with numbers within trending waves and letters with corrective waves. The subscripts — numbers in curly brackets — designate the wave’s degree, which, in Elliott wave analysis, means the relative position of a wave within the larger and smaller structures that make up the chart. R.N. Elliott, who in the 1930s developed the form of analysis that bears his name, viewed the chart as a complex structure of smaller waves nested within larger waves, which in turn are nested within still larger waves. In mathematics it’s called a fractal structure, where at every scale the pattern is similar to the others.
Learning and other resources. Elliott wave analysis provides context, not prophecy. As the 20th century semanticist Alfred Korzybski put it in his book Science and Sanity (1933), “The map is not the territory … The only usefulness of a map depends on similarity of structure between the empirical world and the map.” And I would add, in the ever-changing markets, we can judge that similarity of structure only after the fact.
See the menu page Analytical Methods for a rundown on where to go for information on Elliott wave analysis.
By Tim Bovee, Portland, Oregon, August 19, 2024
Disclaimer
Tim Bovee, Private Trader tracks the analysis and trades of a private trader for his own accounts. Nothing in this blog constitutes a recommendation to buy or sell stocks, options or any other financial instrument. The only purpose of this blog is to provide education and entertainment.
No trader is ever 100 percent successful in his or her trades. Trading in the stock and option markets is risky and uncertain. Each trader must make trading decisions for his or her own account, and take responsibility for the consequences.
License
All content on Tim Bovee, Private Trader by Timothy K. Bovee is licensed under a Creative Commons Attribution-ShareAlike 4.0 International License.
Based on a work at www.timbovee.com.

You must be logged in to post a comment.