3:30 p.m. New York time
Half an hour before the closing bell. The S&P 500 futures fell during the session from the 5640s to slightly below 5610. The initial subwave of an uptrending 5th wave that began on August 5 continues.
9:35 a.m. New York time
What’s happening now? The S&P 500 E-mini futures moved sideways overnight reaching a low in the 5620s and a high in the 5640s
What does it mean? Elliott Wave Theory sees the pause as part of a subwave within the uptrending 5th ewave that began on August 5.
Which subwave? There’s the problem. In the early stages of a wave, the degree of the subwave –how many levels lower — is more a guess than a calculation. And the only way to come up with reasonable guess is to calculate the duration of the waves that came before, and then to label the current subwave so that it is more or less proportional to the earlier waves.
Which I have done. Here’s a spreadsheet showing the duration of the prior waves and what they imply for the duration of the present 5th wave, labeled wave 5{-5} on the chart. Wave 5{-5} is a subwave of wave 5{-4}, which began on April 18, and I’ve also calculated the length of that larger 5th wave as a total of the subwaves
| Prior waves duration | |||||
| WAVE | DEGREE | START | END | DAYS | TOTAL |
| 1 | 5 | 4/18/2024 | 5/23/2024 | 35 | |
| 2 | 5 | 5/23/2024 | 5/31/2024 | 8 | |
| 3 | 5 | 5/31/2024 | 7/16/2024 | 46 | |
| 4 | 5 | 7/16/2024 | 8/5/2024 | 20 | |
| Total | 109 |
| Current wave duration scenarios | |||||
| WAVE | DEGREE | START | END | DAYS | SCENARIO TOTALS |
| 5 | 5 | 8/5/2024 | 9/9/2024 | 35 | 144 |
| 5 | 5 | 8/5/2024 | 8/13/2024 | 8 | 117 |
| 5 | 5 | 8/5/2024 | 9/20/2024 | 46 | 155 |
| 5 | 5 | 8/5/2024 | 8/25/2024 | 20 | 129 |
The four scenarios for the smaller 5th wave — wave 5{-5} — has endings running from August 13 — which means wave 5 has the duration of the previous 2nd wave is already complete — to September 20, meaning the duration is that of the previous 3rd wave.
The present wave 5{-5} has so far lasted for 15 days, far to short a time, it seems to me, for a proportional 5th wave. The most likely comparison among the prior waves is wave 3, usually one of the two longest waves within a trend.
Fifth waves have a lot of variety. There lengths will usually move above the end of the prior 3rd wave, but sometimes a 5th falls short — a truncated wave — and sometimes it goes wildly beyond — extension.
Assuming a 5th of normal duration, I’m redoing the number to assume that wave 5’s length will be similar to that of the prior 3rd wave, with an ending around September 20.
I’ve renumbered the chart to show that the present wave is the 3rd subwave — wave 3{-7} — within the larger 1st subwave — wave 1{-6} — within the uptrending 5th wave — wave 5{-5} — that began on August 5.
If it turns out that the map doesn’t match the terrain — the analysis doesn’t match the chart — then I’ll adjust the wave numbers to conform.
The Chart.
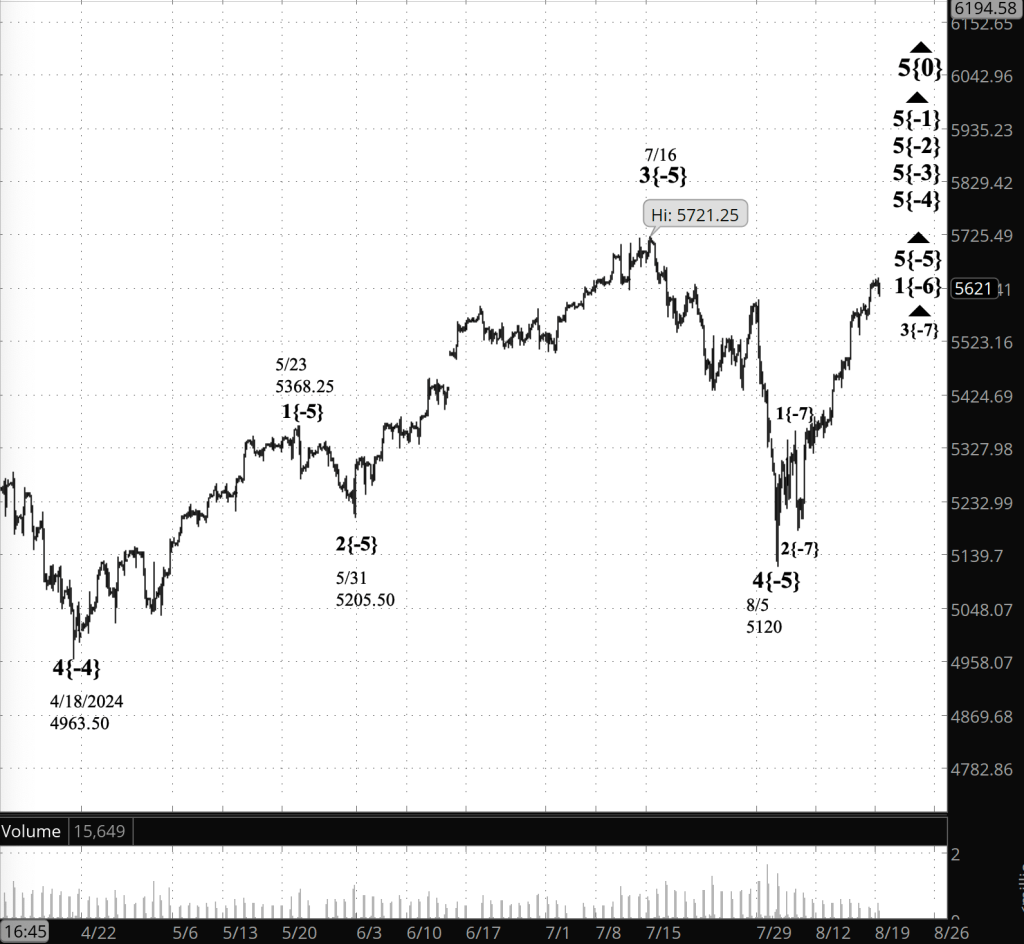
[S&P 500 E-mini futures at 3:30 p.m., 225-minute bars, with volume]
What are the alternatives? See the “Which subwave?” section, above.
What does Elliott wave theory say? Here are the waves that underly the analyses.
Principal Analysis:
- Rising wave 5{0} is underway. It is a wave of Intermediate degree that began in December 2018.
- It is in its final subwave, wave 5{-1}.
- Within wave 5{-1}, rising waves 5{-2}, 5{-3} and 5{-4} are underway, as is wave 5{-5}.
- Wave 5{-5} is in its initial subwave, wave 1{-6}, which in turn is in its middle subwave, wave 3{-7}.
Reading the chart. Price movements — waves – – in Elliott wave analysis are labeled with numbers within trending waves and letters with corrective waves. The subscripts — numbers in curly brackets — designate the wave’s degree, which, in Elliott wave analysis, means the relative position of a wave within the larger and smaller structures that make up the chart. R.N. Elliott, who in the 1930s developed the form of analysis that bears his name, viewed the chart as a complex structure of smaller waves nested within larger waves, which in turn are nested within still larger waves. In mathematics it’s called a fractal structure, where at every scale the pattern is similar to the others.
Learning and other resources. Elliott wave analysis provides context, not prophecy. As the 20th century semanticist Alfred Korzybski put it in his book Science and Sanity (1933), “The map is not the territory … The only usefulness of a map depends on similarity of structure between the empirical world and the map.” And I would add, in the ever-changing markets, we can judge that similarity of structure only after the fact.
See the menu page Analytical Methods for a rundown on where to go for information on Elliott wave analysis.
By Tim Bovee, Portland, Oregon, August 20, 2024
Disclaimer
Tim Bovee, Private Trader tracks the analysis and trades of a private trader for his own accounts. Nothing in this blog constitutes a recommendation to buy or sell stocks, options or any other financial instrument. The only purpose of this blog is to provide education and entertainment.
No trader is ever 100 percent successful in his or her trades. Trading in the stock and option markets is risky and uncertain. Each trader must make trading decisions for his or her own account, and take responsibility for the consequences.
License
All content on Tim Bovee, Private Trader by Timothy K. Bovee is licensed under a Creative Commons Attribution-ShareAlike 4.0 International License.
Based on a work at www.timbovee.com.

You must be logged in to post a comment.