3:30 p.m. New York time
Half an hour before the closing bell. The S&P 500 futures broke a firm rule of Elliott Wave Theory, as discussed in this morning’s analysis. The 4th-wave downward correction continues.
At the start of the session, the correction was in its middle subwave, wave B.
A few days ago I had identified the 4th wave as taking the form of a Zigzag, and the rule for that form is that a B wave cannot move beyond the start of the preceding A wave. During the session the S&P 500 futures attained a high of 5669, which 3.75 points higher than the starting point of wave A. Time for a reanalysis.
Wave B breaks a rule.
In analyses last week I referred to the ambiguity of the wave A count. If it’s a Zigzag correction, the A wave will have five subwaves; if a Flat, three subwaves.
I counted five subwaves on the futures chart this morning, making the correction a Zigzag. The simplest reanalysis, and therefore the most likely, is to revisit the nature of the correction. A Flat correction has three subwaves in wave A, and the firm rule for a B wave within a Flat is that it must retrace at least 90% of the A wave, with no upper limit specified.
A closer look at the futures chart didn’t clarify the matter, but the S&P 500 index chart can be read as having three subwaves within wave A, although that chart also has some ambiguities.
Ultimately, the Index is the source of all of its derivatives, including the futures, and I give it greater weight in resolving a rule violation.
New Principal Analysis
The downward correction that began on August 22 continues and is taking the form of a Flat. Wave B within wave 4 ended during the August 26 session at 5669, and the subsequent decline is the early stages of wave C.
Chart of the New Analysis
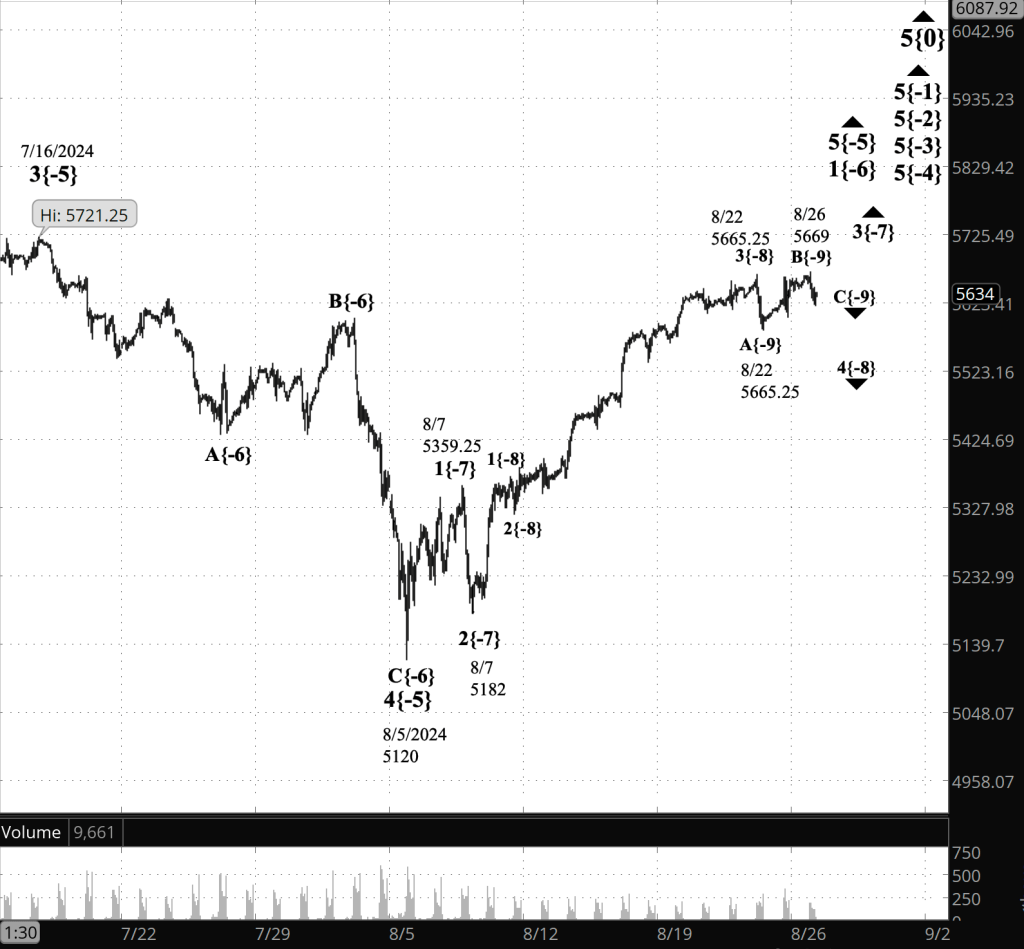
[S&P 500 E-mini futures at 3:30 p.m., 70-minute bars, with volume]
9:35 a.m. New York time
The analysis below was discredited during the session by an Elliott Wave Theory rule violation. See the afternoon update, above, for the new analysis.
What’s happening now? The S&P 500 E-mini futures rose into the 5660s after trading resumed overnight.
What does it mean? Elliott Wave Theory sees the 4th-wave downward correction that began on August 22 being in its middle subwave, wave B.
There is, however, a looming problem for the analysis. The A wave preceding the current wave B had five subwaves. That means that the correction is taking the Zigzag form. A firm rule of Elliott Wave Theory says that the B wave in a Zigzag never moves beyond the starting point of the preceding wave A.
In this case, wave A ended at 5665.25. Wave B overnight reached a high of 5664.50. That means wave B is $1 away from from violating the rule, which would invalidate the present analysis.
In theory the rule is violated if the price reaches 5665.26, but the futures move in 25-cent increments, so rather than the price being 76 points away from moving beyond the overnight high, it would take a $1 rise.
Chart of the Discredited Analysis

[S&P 500 E-mini futures at 9:35 a.m., 70-minute bars, with volume]
What are the alternatives? None at present. Without a doubt, they will develop
What does Elliott wave theory say? Here are the waves that underly the afternoon analyses. The morning analysis was invalidated by a violation of an Elliott Wave Theory rule.
Principal Analysis:
- Rising wave 5{0} is underway. It is a wave of Intermediate degree that began in December 2018.
- It is in its final subwave, wave 5{-1}.
- Within wave 5{-1}, rising waves 5{-2}, 5{-3} and 5{-4} are underway, as is wave 5{-5}.
- Wave 5{-5} is in its initial subwave, wave 1{-6}, which in turn is in its middle subwave, wave 3{-7}.
- Wave 3{-7} is in its next-to-the-last subwave, wave 4{-8}, a downward correction.
- Wave 4{-8} is in its final subwave, wave C{-9}
Reading the chart. Price movements — waves – – in Elliott wave analysis are labeled with numbers within trending waves and letters with corrective waves. The subscripts — numbers in curly brackets — designate the wave’s degree, which, in Elliott wave analysis, means the relative position of a wave within the larger and smaller structures that make up the chart. R.N. Elliott, who in the 1930s developed the form of analysis that bears his name, viewed the chart as a complex structure of smaller waves nested within larger waves, which in turn are nested within still larger waves. In mathematics it’s called a fractal structure, where at every scale the pattern is similar to the others.
Learning and other resources. Elliott wave analysis provides context, not prophecy. As the 20th century semanticist Alfred Korzybski put it in his book Science and Sanity (1933), “The map is not the territory … The only usefulness of a map depends on similarity of structure between the empirical world and the map.” And I would add, in the ever-changing markets, we can judge that similarity of structure only after the fact.
See the menu page Analytical Methods for a rundown on where to go for information on Elliott wave analysis.
By Tim Bovee, Portland, Oregon, August 26, 2024
Disclaimer
Tim Bovee, Private Trader tracks the analysis and trades of a private trader for his own accounts. Nothing in this blog constitutes a recommendation to buy or sell stocks, options or any other financial instrument. The only purpose of this blog is to provide education and entertainment.
No trader is ever 100 percent successful in his or her trades. Trading in the stock and option markets is risky and uncertain. Each trader must make trading decisions for his or her own account, and take responsibility for the consequences.
License
All content on Tim Bovee, Private Trader by Timothy K. Bovee is licensed under a Creative Commons Attribution-ShareAlike 4.0 International License.
Based on a work at www.timbovee.com.

You must be logged in to post a comment.