3:30 p.m. New York time
Half an hour before the closng bell. The S&P 500 futures rose to 5663.75 during the session, and then fell sharply back into the 5990s.
Applying Elliott Wave Theory, the pattern matches the principal analysis laid out this morning: The prior rise was the 4th subwave within wave C, which in turn is the final subwave of the 4th-wave downward correction that began on August 22.
The session high fell short by a few points of the start of wave C, from 5669. Under the principal analysis, the subsequent decline is the 5th and final subwave within wave C.
What happens next?
This section is lifted verbatim from Tuesday, August 27 Trader’s Notebook.
There are two possibilities after wave C is complete, and possibilities within each possibility.
The 5th-wave uptrend will follow the end of the compound 4th-wave correction.
Most of the time, wave C is the end of the correction. In this case, the correction — wave 4 — will be followed by an uptrending 5th waves that, if typical, will move into the 5660s, beyond the beginning of wave 4, and possibly higher.
Some 5th waves are truncated and fail to reach the starting point of the preceding 4th wave.
Some 5th waves are extended and move much further beyond the beginning of the 4th wave, traveling a greater distance than proportionality suggested by the context of the wave.
Some corrective waves, especially 4th waves, form a compound structure, containing two or three A-B-C wave patterns. If that were to occur, then the present declining C wave within wave 4 would be followed by a rising X wave and then by another declining A wave, which will be followed by waves B and C. If the compound structure takes a triple form, there will be a second X wave, followed by a third A-B-C pattern.
And there’s an alternative. It’s possible to fit the session’s rise and decline pattern into this morning’s alternative analysis, which sees yesterday’s low, 5661.25, as being the end of wave C. If that’s the case, then wave 5, one degree larger, has begun. The rise that ended during the session is the 1st subwave within wave 5, and the decline now underway is the 2nd subwave.
This scenario will be disproven if the present decline falls below 5561.25, the start of the initial subwave — wave 1 — since it is a firm rule of Elliott Wave Theory that wave 2 never moves beyond the start of wave 1.
Charts. I’ve udpated the the lower, broader-view chart. The upper, close-up chart is unchanged.
9:35 a.m. New York time
What’s happening now? The S&P 500 E-mini futures rose overnight, so far reaching into the 5630s as it retraces a portion of yesterday’s session decline.
What does it mean? Elliott Wave Theory sees the decline as the end of the middle subwave — wave 3 — within wave C, which is in turn the final subwave of the low-degree 4th-wave downward correction that began on August 22.
Close-up view. Here’s a close-up view of the downward correction, taken 35 minutes before the opening bell, showing the subwave count to wave C. In three-wave corrections — the pattern most often seen — the C-wave has five subwaves.
The next-to-the-last subwave within wave C — rising wave 4 — is now underway.
[S&P 500 E-mini futures at 8:55 a.m., 15-minute bars, with volume]
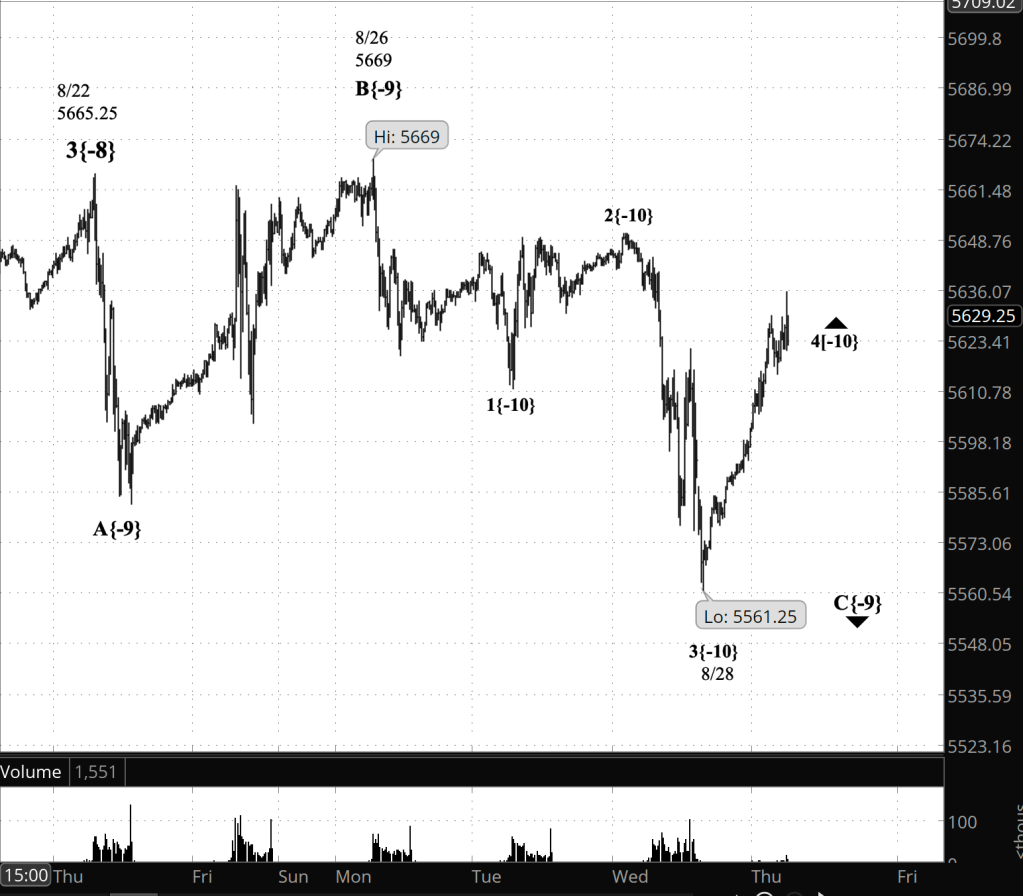
A broader view. The 4th-wave correction is the next-to-the-last subwave within a 3rd-wave uptrend that began on August 7. Encompassing that uptrend is a larger uptrend, the 1st wave within a larger 5th-wave uptrend that began on August 5.

[S&P 500 E-mini futures at 3:30 p.m., 80-minute bars, with volume]
What are the alternatives? If I squint my eyes at the chart, I can see yesterday’s session low, 5561.25, as being the end of the 5th and final wave within wave C. Should the price rise above the 5669, the end of the middle subwave, wave B, within the 4th-wave downward correction, then this scenario becomes more likely.
What does Elliott wave theory say? Here are the waves that underly the analyses.
Principal Analysis:
- Rising wave 5{0} is underway. It is a wave of Intermediate degree that began in December 2018.
- It is in its final subwave, wave 5{-1}.
- Within wave 5{-1}, rising waves 5{-2}, 5{-3} and 5{-4} are underway, as is wave 5{-5}.
- Wave 5{-5} is in its initial subwave, wave 1{-6}, which in turn is in its middle subwave, wave 3{-7}.
- Wave 3{-7} is in its next-to-the-last subwave, wave 4{-8}, a downward correction.
- Wave 4{-8} is in its final subwave, wave C{-9}.
Reading the chart. Price movements — waves – – in Elliott wave analysis are labeled with numbers within trending waves and letters with corrective waves. The subscripts — numbers in curly brackets — designate the wave’s degree, which, in Elliott wave analysis, means the relative position of a wave within the larger and smaller structures that make up the chart. R.N. Elliott, who in the 1930s developed the form of analysis that bears his name, viewed the chart as a complex structure of smaller waves nested within larger waves, which in turn are nested within still larger waves. In mathematics it’s called a fractal structure, where at every scale the pattern is similar to the others.
Learning and other resources. Elliott wave analysis provides context, not prophecy. As the 20th century semanticist Alfred Korzybski put it in his book Science and Sanity (1933), “The map is not the territory … The only usefulness of a map depends on similarity of structure between the empirical world and the map.” And I would add, in the ever-changing markets, we can judge that similarity of structure only after the fact.
See the menu page Analytical Methods for a rundown on where to go for information on Elliott wave analysis.
By Tim Bovee, Portland, Oregon, August 29, 2024
Disclaimer
Tim Bovee, Private Trader tracks the analysis and trades of a private trader for his own accounts. Nothing in this blog constitutes a recommendation to buy or sell stocks, options or any other financial instrument. The only purpose of this blog is to provide education and entertainment.
No trader is ever 100 percent successful in his or her trades. Trading in the stock and option markets is risky and uncertain. Each trader must make trading decisions for his or her own account, and take responsibility for the consequences.
License
All content on Tim Bovee, Private Trader by Timothy K. Bovee is licensed under a Creative Commons Attribution-ShareAlike 4.0 International License.
Based on a work at www.timbovee.com.

You must be logged in to post a comment.