3:30 p.m. New York Time
Half an hour before the closing bell. The S&P 500 futures fell sharply during the session, from the 5910s into the 58 50s so far. The length of the decline has produced some ambiguities regarding the subwaves of the 5th-wave rise that began on October 10.
Elliott Wave Theory: Ambiguities abound.
- This morning’s principle wave count, where the 4th subwave has begun, remains viable, maybe.
- A rule of Elliott Wave Theory says a 4th subwave can’t move beyond the end of the preceding 1st subwave. By my preferred count, it’s close but has not crossed the 1st subwave endpoint at 5737.75
- By the rule-breaking count, although reasonable as a pattern on the chart, the price has moved below the end of the 1st wave-crossing the line at 5868.25. This calls for a major reanaysis.
- Under this mornings alternative wave count, the status of the 5th subwave is quite ambiguous.
- Potentially, the 5th subwave has ended, which means the end of three parent and grandparent waves of increasing size.
- Not mentioned this morning, but its possible that the larger 5th wave rise is really a 3rd wave rise, which requires a major re-analysis.
9:35 a.m. New York time
What’s happening now? The S&P 500 E-mini futures dropped slightly overnight, reversing as the opening bell approached.
What does it mean? The slight decline and reversal, when Elliott Wave Theory are applied are part of a 4th-wave upward correction, a subwave within a rising 5th wave that began on October 10. When that small wave 4 is complete, it will be followed by a rising 5th wave, a subwave of the larger 5th wave.
It is that smaller rising 5th subwave whose end will trigger a cascade of 5th-wave completions up the fractal structure of the chart.
As labeled on the chart, each wave has a number followed by a subscript, in curly brackets, saying how many degrees within the fractal structure the wave stands in relation to the Intermediate degree, rising wave 5{0}, which began in December 2018. Waves with negative subscripts are smaller than the Intermediate wave, and those with positive subscripts are larger.
As seen on the chart, wave 4{-11}, a downward correction, is underway. It will be followed by rising wave 5{-11}, whose completion will also be the end of waves 5{-10], 5{-9} and 5{-8}.
Wave 5{-8} began on September 6 and is subwave of wave 3{-7}, which began on August 7 from 5182. It will be followed by a 4th-wave downward correction of relatively generous proportions compared the lower-degree wave 4s we’ve seen in the last few months.
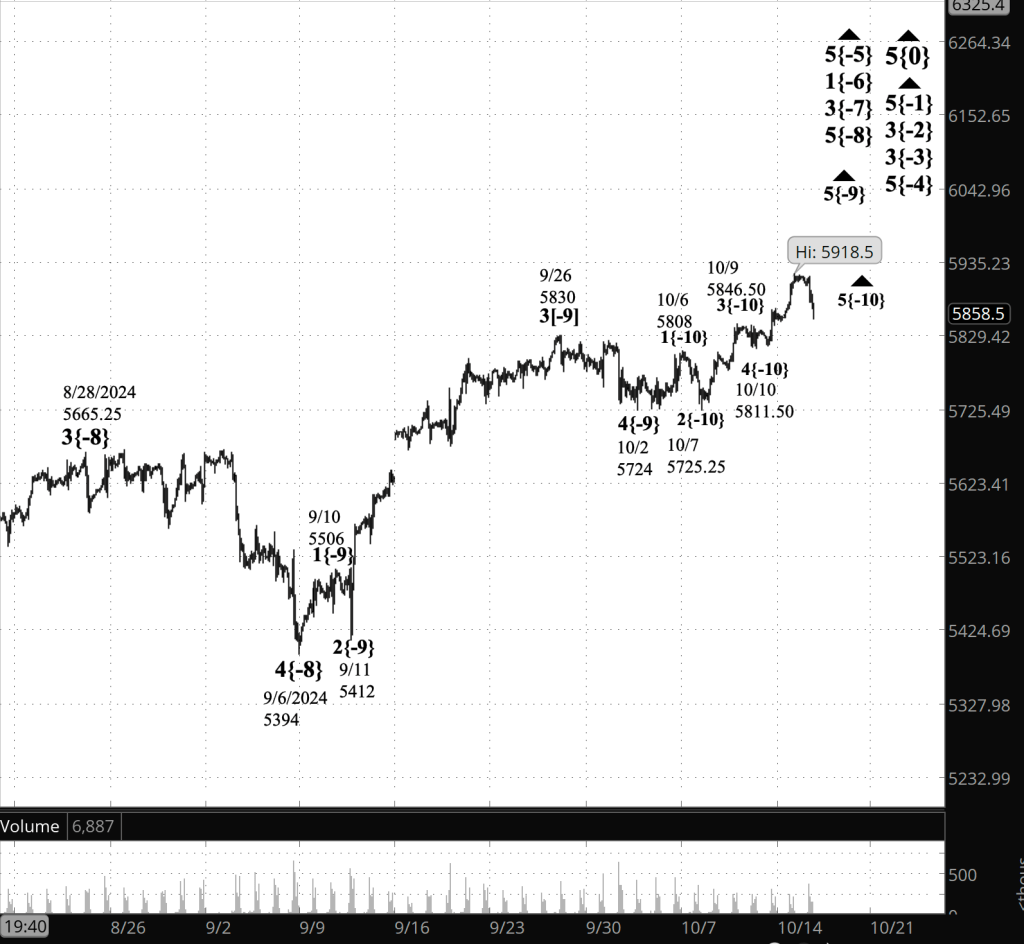
[S&P 500 E-mini futures at 3:30 pm., 100-minute bars, with volume]
What are the alternatives? There is some ambiguity within the wave 5{-11} subwave count. It will be resolved as that 5th wave progresses toward its end.
What does Elliott wave theory say? Here are the waves that underly the analysis.
Principal Analysis:
- Rising wave 5{0} is underway. It is a wave of Intermediate degree that began in December 2018.
- It is in its final subwave, wave 5{-1}.
- Within wave 5{-1}, rising waves 5{-2}, 5{-3} and 5{-4} are underway, as is wave 5{-5}.
- Wave 5{-5} is in its initial subwave, wave 1{-6}, which in turn is in its middle subwave, wave 3{-7}.
- Wave 3{-7} is in its final; subwave, uptrending wave 5{-8}.
- Wave 5{-8} is in its final subwave, wave 5{-9}, which is in its final subwave, rising wave 5{-10}.
- Wave 5{-10} is in its next-to-the-last subwave, wave 4{-11}.
Long-term Waves.
These are the waves currently in progress under my principal analysis. Each line on the list shows the wave number, with the subscript in curly brackets, the traditional degree name, the starting date, the starting price of the S&P 500 E-mini futures, and the direction of the wave.
- S&P 500 Index:
- 5{+3} Supercycle, 7/8/1932, 4.40 (up)
- 5{+2} Cycle, 12/9/1974, 60.96 (up)
- 5{+1} Primary, 3/6/2009, 666.79 (up)
- 5{0} Intermediate, 12/26/2018, 2346.58 (up)
- S&P 500 Futures
- 5{-1} Minor, 10/27/2023, 4127.25 (up)
- 3{-2} Minute, 10/27/23, 4127.75 (up)
- 3{-3} Minuette, 10/27/23, 4127.75 (up)
- 5{-4} Subminuette, 4/18/2024, 4963.50 (up)
- 5{-5} Micro, 8/5/2024, 5120 (up)
- 1{-6} Submicro, 8/5/2024, 5120 (up)
- 3{-7} Minuscule, 8/7/2024, 5182 (up)
- 5{-8} (unnamed), 9/6/2024, 5394 (up)
Reading the chart. Price movements — waves – – in Elliott wave analysis are labeled with numbers within trending waves and letters with corrective waves. The subscripts — numbers in curly brackets — designate the wave’s degree, which, in Elliott wave analysis, means the relative position of a wave within the larger and smaller structures that make up the chart. R.N. Elliott, who in the 1930s developed the form of analysis that bears his name, viewed the chart as a complex structure of smaller waves nested within larger waves, which in turn are nested within still larger waves. In mathematics it’s called a fractal structure, where at every scale the pattern is similar to the others.
Learning and other resources. Elliott wave analysis provides context, not prophecy. As the 20th century semanticist Alfred Korzybski put it in his book Science and Sanity (1933), “The map is not the territory … The only usefulness of a map depends on similarity of structure between the empirical world and the map.” And I would add, in the ever-changing markets, we can judge that similarity of structure only after the fact.
See the menu page Analytical Methods for a rundown on where to go for information on Elliott wave analysis.
By Tim Bovee, Portland, Oregon, October 15, 2024
Disclaimer
Tim Bovee, Private Trader tracks the analysis and trades of a private trader for his own accounts. Nothing in this blog constitutes a recommendation to buy or sell stocks, options or any other financial instrument. The only purpose of this blog is to provide education and entertainment.
No trader is ever 100 percent successful in his or her trades. Trading in the stock and option markets is risky and uncertain. Each trader must make trading decisions for his or her own account, and take responsibility for the consequences.
License
All content on Tim Bovee, Private Trader by Timothy K. Bovee is licensed under a Creative Commons Attribution-ShareAlike 4.0 International License.
Based on a work at www.timbovee.com.

You must be logged in to post a comment.