3:30 p.m. New York time
Half an hour before the closing bell. About this morning’s analysis. The alternative scenario has won the prize and has been promoted to the principal analysis. This morning’s principal analysis has been demoted to the rank of might-of-have-been.
The SP 500 futures fell sharply during the session, coming close to 5800. The 4th-wave downward correction that began on October 17 continues. The wave that will follow, a 5th-wave uptrend, still lies in the future.
Here’s an updated chart with the new principal analysis. I’ve retained this morning’s chart below.
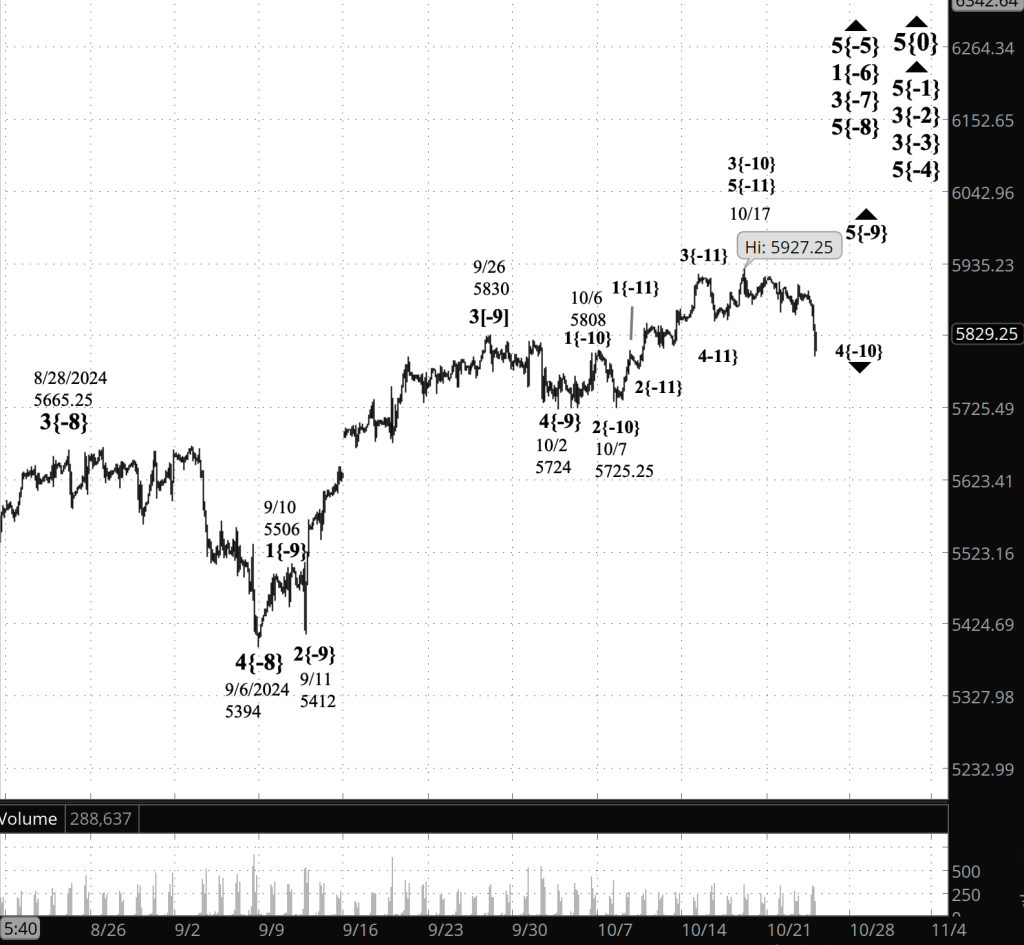
[S&P 500 E-mini futures at 3:30 p.m., 115-minute bars, with volume]
9:35 a.m. New York time
What’s happening now? The S&P 500 E-mini futures declined overnight, remaining above yesterday’s session low, 5861.25.
What does it mean? The 4th-wave downward correction that began on October 17 may have reached its end on October 22, based on an Elliott Wave Theory analysis.
Typically, a 4th-wave correction will contain three subwaves, and the correction’s endoint will be within the 4th subwave of the previous 3rd wave of the same degree. Check on both counts. It’s also possible that the chart is working through final subwave — wave C — within wave 4.
I’ve marked the chart as though wave 4 had ended on October 22, but with a great big caveat: The 4th wave may bot be complete, meaning more decline lies ahead.
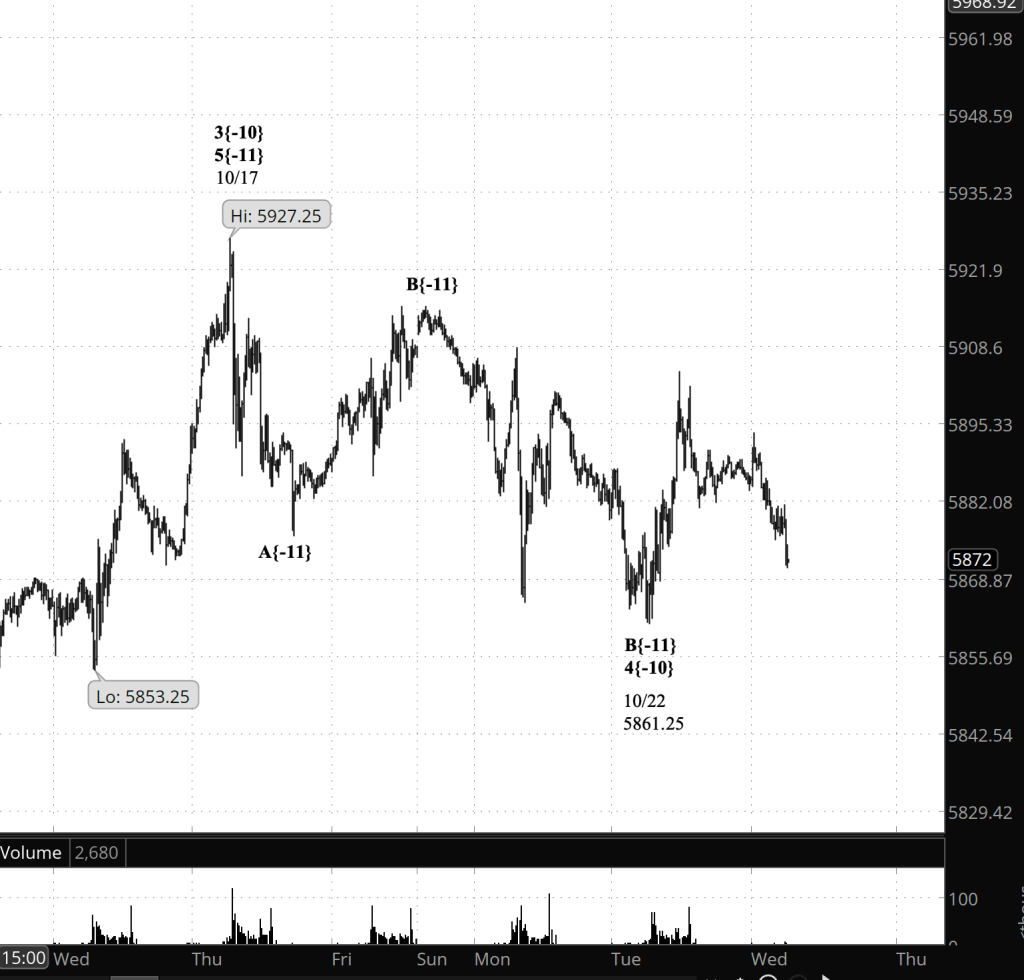
[S&P 500 E-mini futures at 9 a.m., 15-minute bars, with volume]
If uptrending wave 5 has begun, then it is most likely in its initial subwave. Fifth waves can be quirky beasts Sometmes they move beyond the end of the preceding 3rd wave, sometimes they come up short — truncation — and sometimes they move further than expected two a disproportional degree.
The rise that began on October 27, 2023 — nearly a year ago — is still under way. A glance at the “Long-term Waves” section, below, shows the extent to which the market has reached a turning point.
When the present, quite small, 5th wave is complete, it will also impact two larger 5th waves and an even larger 3rd wave, ushering in a downward correction of significant size.
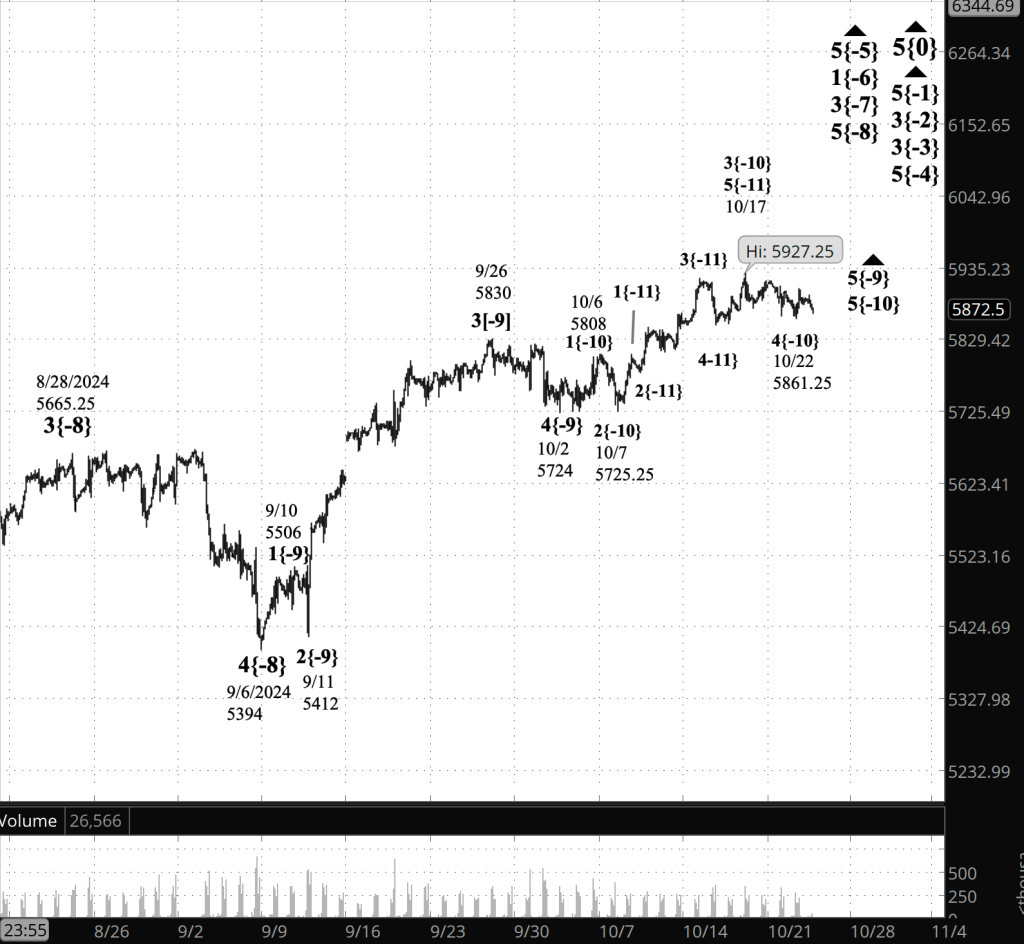
[S&P 500 E-mini futures at 9:35 a.m., 115-minute bars, with volume]
[Superceded by the afternoon analysis, retained for comparison]
What are the alternatives? As noted above, if the present wave dips below 5861.25, the end of the 4th wave correction in the principal analysis, then the 4th wave is not yet complete and the 5th wave that follows has not yet begun. [This alternative from this morning has beebn disproven by subsequent events and is no longer valid.]
What does Elliott wave theory say? Here are the waves that underly the analyses.
Principal Analysis: [Updated to match the afternoon analysis, after the chart disproved the former Principal Analysis, that labeled wave 4{-10} as having ended and the subsequent wave 5{-10} as having begun.
- Rising wave 5{0} is underway. It is a wave of Intermediate degree that began in December 2018.
- It is in its final subwave, wave 5{-1}.
- Within wave 5{-1}, rising waves 5{-2}, 5{-3} and 5{-4} are underway, as is wave 5{-5}.
- Wave 5{-5} is in its initial subwave, wave 1{-6}, which in turn is in its middle subwave, wave 3{-7}.
- Wave 3{-7} is in its final; subwave, uptrending wave 5{-8}.
- Wave 5{-8} is in its final subwave, wave 5{-9}, which is in its next-to-the-last subwave, corrective wave 4{-10}.
Long-term Waves.
These are the waves currently in progress under my principal analysis. Each line on the list shows the wave number, with the subscript in curly brackets, the traditional degree name, the starting date, the starting price of the S&P 500 E-mini futures, and the direction of the wave.
- S&P 500 Index:
- 5{+3} Supercycle, 7/8/1932, 4.40 (up)
- 5{+2} Cycle, 12/9/1974, 60.96 (up)
- 5{+1} Primary, 3/6/2009, 666.79 (up)
- 5{0} Intermediate, 12/26/2018, 2346.58 (up)
- S&P 500 Futures
- 5{-1} Minor, 10/27/2023, 4127.25 (up)
- 3{-2} Minute, 10/27/23, 4127.75 (up)
- 3{-3} Minuette, 10/27/23, 4127.75 (up)
- 5{-4} Subminuette, 4/18/2024, 4963.50 (up)
- 5{-5} Micro, 8/5/2024, 5120 (up)
- 1{-6} Submicro, 8/5/2024, 5120 (up)
- 3{-7} Minuscule, 8/7/2024, 5182 (up)
- 5{-8} (unnamed), 9/6/2024, 5394 (up)
- 5{-9} (unnamed), 10/2/2024, 5724 (up)
- 4{-10} (unnamed), 10/17/2024, 5927.25 (down)
Reading the chart. Price movements — waves – – in Elliott wave analysis are labeled with numbers within trending waves and letters with corrective waves. The subscripts — numbers in curly brackets — designate the wave’s degree, which, in Elliott wave analysis, means the relative position of a wave within the larger and smaller structures that make up the chart. R.N. Elliott, who in the 1930s developed the form of analysis that bears his name, viewed the chart as a complex structure of smaller waves nested within larger waves, which in turn are nested within still larger waves. In mathematics it’s called a fractal structure, where at every scale the pattern is similar to the others.
Learning and other resources. Elliott wave analysis provides context, not prophecy. As the 20th century semanticist Alfred Korzybski put it in his book Science and Sanity (1933), “The map is not the territory … The only usefulness of a map depends on similarity of structure between the empirical world and the map.” And I would add, in the ever-changing markets, we can judge that similarity of structure only after the fact.
See the menu page Analytical Methods for a rundown on where to go for information on Elliott wave analysis.
By Tim Bovee, Portland, Oregon, October 23, 2024
Disclaimer
Tim Bovee, Private Trader tracks the analysis and trades of a private trader for his own accounts. Nothing in this blog constitutes a recommendation to buy or sell stocks, options or any other financial instrument. The only purpose of this blog is to provide education and entertainment.
No trader is ever 100 percent successful in his or her trades. Trading in the stock and option markets is risky and uncertain. Each trader must make trading decisions for his or her own account, and take responsibility for the consequences.
License
All content on Tim Bovee, Private Trader by Timothy K. Bovee is licensed under a Creative Commons Attribution-ShareAlike 4.0 International License.
Based on a work at www.timbovee.com.

You must be logged in to post a comment.