3:30 p.m. New York time
Half an hour before the closing bell. The S&P 500 futures rose during the session, reaching slightly above 6040.
The middle subwave—wave 3—within the uptrending final subwave—wave 5—is part of a sequence of three 5th waves, each increasing in size. All are subwaves within a larger 3rd wave that began on August 7 at 5182. When the smallest of these 5th waves concludes, it will signal the end of the entire sequence. At the highest degree, this will also mark the completion of the 3rd wave and the beginning of a 4th-wave downward correction.
Shorter version: Expect an uptrend for a while, but keep in mind, no uptrend lasts forever. A correction follows every uptrend.
9:35 a.m. New York time
What’s happening now? The S&P 500 E-mini futures traded sideways for much of the overnight period, dropping from 6010 into the 5990s as the opening bell approached.
What does it mean? According to Elliott Wave Theory, the 5th-wave uptrend that began on November 4 continues to unfold through its early subwaves.
One challenge in Elliott Wave analysis is the difficulty in accurately placing a wave within the fractal structure of the chart. Is the rise since November 4 an unusually long 1st subwave within the 5th-wave uptrend? Or is it a 4th wave within an exceptionally strong 5th-wave rise with poorly delineated subwaves? Or perhaps it is another variation that has yet to come to mind as I ponder the chart, sipping my morning green tea.
One indicator is the length of the 5th wave relative to others of the same degree.
To avoid confusion, I’ll use the wave labeling system from the chart: the wave number and a subscript in curly brackets indicating the wave’s degree relative to the Intermediate degree. The present Intermediate wave is wave 5{0}, which began in December 2018.
The current 5th wave, 5{-10}, has so far covered 288.75 points. The preceding 3rd wave of the same degree, wave 3{-10}, covered 202 points from start to finish.
Moving one degree higher, the ongoing final wave, wave 5{-9}, has covered 289 points. The preceding 3rd wave of that degree, wave 3{-9}, spanned 418 points in total.
Thus, the present uptrending 5th wave, wave 5{-10}, is perfectly in line with the preceding wave of that degree, wave 3{-10}. The 1st wave of the same degree, wave 1{-10}, covered a distance of 84 points.
For my principal analysis, I’m treating the rise as 5{-10} within its 3rd subwave.
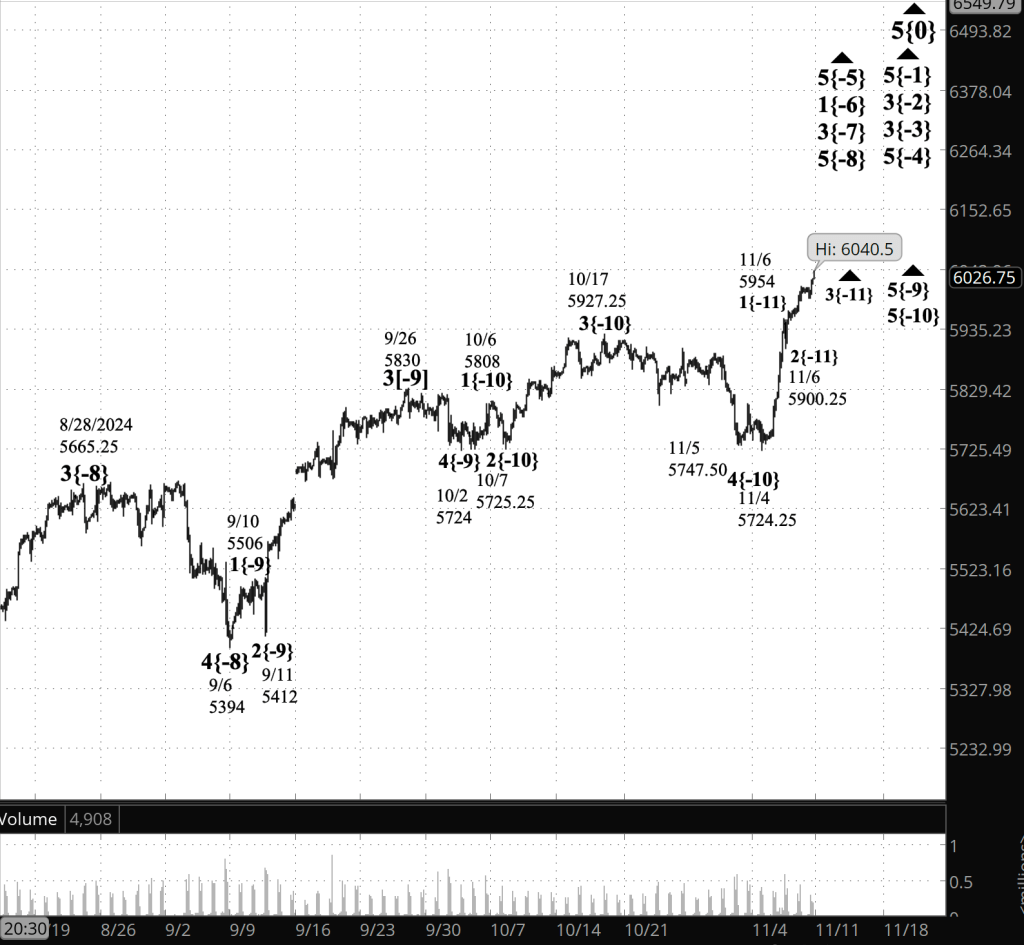
[S&P 500 E-mini futures at 3:30 p.m., -minute bars, with volume]
What are the alternatives? The subwave analysis may well change as the 5th wave’s internal structure gains clarity.
What does Elliott wave theory say? Here are the waves that underly the analyses.
Principal Analysis:
- .Rising wave 5{0} is underway. It is a wave of Intermediate degree that began in December 2018.
- It is in its final subwave, wave 5{-1}.
- Within wave 5{-1}, rising waves 5{-2}, 5{-3} and 5{-4} are underway, as is wave 5{-5}.
- Wave 5{-5} is in its initial subwave, wave 1{-6}, which in turn is in its middle subwave, wave 3{-7}.
- Wave 3{-7} is in its final; subwave, uptrending wave 5{-8}.
- Wave 5{-8} is in its final subwave, wave 5{-9}, which is in its final subwave, uptrending wave 5{-10}.
Long-term Waves.
- These are the waves currently in progress under my principal analysis. Each line on the list shows the wave number, with the subscript in curly brackets, the traditional degree name, the starting date, the starting price of the S&P 500 E-mini futures, and the direction of the wave.
- S&P 500 Index:
- 5{+3} Supercycle, 7/8/1932, 4.40 (up)
- 5{+2} Cycle, 12/9/1974, 60.96 (up)
- 5{+1} Primary, 3/6/2009, 666.79 (up)
- 5{0} Intermediate, 12/26/2018, 2346.58 (up)
- S&P 500 Futures
- 5{-1} Minor, 10/27/2023, 4127.25 (up)
- 3{-2} Minute, 10/27/23, 4127.75 (up)
- 3{-3} Minuette, 10/27/23, 4127.75 (up)
- 5{-4} Subminuette, 4/18/2024, 4963.50 (up)
- 5{-5} Micro, 8/5/2024, 5120 (up)
- 1{-6} Submicro, 8/5/2024, 5120 (up)
- 3{-7} Minuscule, 8/7/2024, 5182 (up)
- 5{-8} (unnamed), 9/6/2024, 5394 (up)
- 5{-9} (unnamed), 10/2/2024, 5724 (up)
- 5{-10} (unnamed), 11/4/2024, 5824.25 (up)
- 3{-11} (unnamed), 11/6/2024, 5900.25
Reading the chart. Price movements — waves – – in Elliott wave analysis are labeled with numbers within trending waves and letters with corrective waves. The subscripts — numbers in curly brackets — designate the wave’s degree, which, in Elliott wave analysis, means the relative position of a wave within the larger and smaller structures that make up the chart. R.N. Elliott, who in the 1930s developed the form of analysis that bears his name, viewed the chart as a complex structure of smaller waves nested within larger waves, which in turn are nested within still larger waves. In mathematics it’s called a fractal structure, where at every scale the pattern is similar to the others.
Learning and other resources. Elliott wave analysis provides context, not prophecy. As the 20th century semanticist Alfred Korzybski put it in his book Science and Sanity (1933), “The map is not the territory … The only usefulness of a map depends on similarity of structure between the empirical world and the map.” And I would add, in the ever-changing markets, we can judge that similarity of structure only after the fact.
See the menu page Analytical Methods for a rundown on where to go for information on Elliott wave analysis.
By Tim Bovee, Portland, Oregon, November 8, 2024
Disclaimer
Tim Bovee, Private Trader tracks the analysis and trades of a private trader for his own accounts. Nothing in this blog constitutes a recommendation to buy or sell stocks, options or any other financial instrument. The only purpose of this blog is to provide education and entertainment.
No trader is ever 100 percent successful in his or her trades. Trading in the stock and option markets is risky and uncertain. Each trader must make trading decisions for his or her own account, and take responsibility for the consequences.
License
All content on Tim Bovee, Private Trader by Timothy K. Bovee is licensed under a Creative Commons Attribution-ShareAlike 4.0 International License.
Based on a work at www.timbovee.com.

You must be logged in to post a comment.