3:30 p.m. New York time
Half an hour before the closing bell. The S&P 500 futures fell during the session, from the 5930s to the 5970s.
Elliott Wave Theory: The 4th wave downward correction continued to fall, lending credence to this morning’s principal analysis, that wave 4 is in its final subwave, wave C.
9:35 a.m. New York time
What’s happening now? The S&P 500 E-mini futures fell overnight, from the 5970s to the 5930s.
What does it mean? Elliott Wave Theory analysis suggests that the 4th-wave downward correction that began on November 11 is nearing its end, if the correction takes a typical form. If not, then the correction will take longer than seems likely at present.
Here’s a line-up of where the correction stands and possibilities that may lie ahead.
- The 4th wave corrective pattern is in its final subwave, wave C.
- Wave C will have five subwaves and presently is in its final subwave, wave 5.
- Typically a 4th-wave correction will contain one corrective pattern.
- Occasionally, a 4th wave will form a compound correction, containing two or three corrective patterns, with the second and third connector waves separated from the pattern before it by connector waves.
- Whether simple or compound, once the final corrective pattern is complete, it will be the end of the 4th-wave compound correction.
- An uptrending 5th wave will follow and will have five subwaves.
- A 5th wave usually will move beyond the end of the preceding 3rd wave, 6053.25 in the present case.
- Sometimes the 5th wave ends below that level, a condition known as truncation.
- At other times, the 5th wave moves beyond the end wave 3, traveling further than usual in a condition known as extension.
- And, most often, wave 5 will move beyond the end of wave 3, traveling a distance consistent with the wave structure. (How is that distance measured? I’ve found no clear guidance in Elliott Wave Theory.)
- The end of wave 5 will trigger the simultaneous end three 5th waves, each a degree higher than the one before it.
- Also ending will be a 3rd wave, an additional degree higher . The 3rd wave began on August 7 from 5182.
- The 3rd wave, covering more than three months, will be followed by a 4th-wave downward correction of considerable size.
- The 4th-wave correction, if it is typical, will end within the range of the 4th subwave within wave 3. That range is from 5665.25 down to 5394.
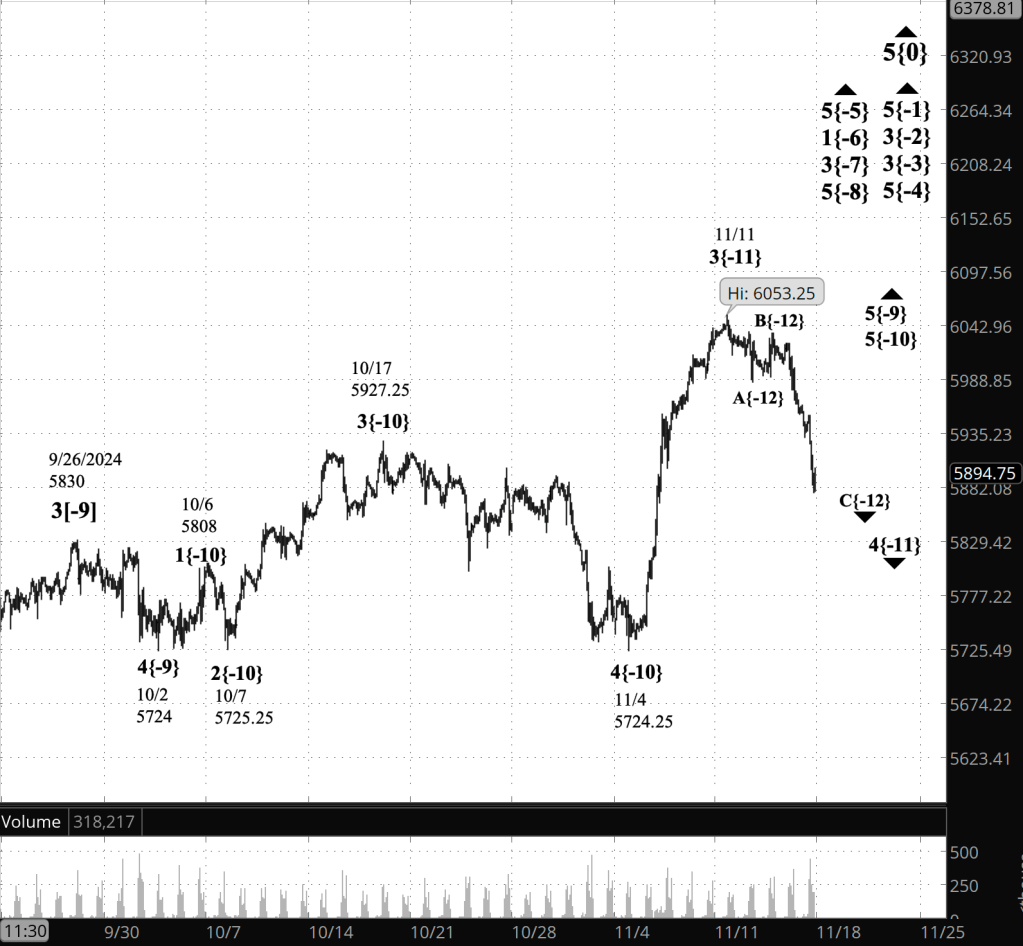
[S&P 500 E-mini futures at 9:35 a.m., 90-minute bars, with volume]
What are the alternatives? For the principal analysis, above, I’ve counted the 4th-wave downward correction since November 11 as being in its final subwave. It’s possible that the whole pattern is the 1st subwave, wave A, and the A-B-C pattern is one degree lower, and that is the alternative analysis.
What does Elliott wave theory say? Here are the waves that underly the analyses.
Principal Analysis:
- Rising wave 5{0} is underway. It is a wave of Intermediate degree that began in December 2018.
- It is in its final subwave, wave 5{-1}.
- Within wave 5{-1}, rising waves 5{-2}, 5{-3} and 5{-4} are underway, as is wave 5{-5}.
- Wave 5{-5} is in its initial subwave, wave 1{-6}, which in turn is in its middle subwave, wave 3{-7}.
- Wave 3{-7} is in its final; subwave, uptrending wave 5{-8}.
- Wave 5{-8} is in its final subwave, wave 5{-9}, which is in its final subwave, uptrending wave 5{-10}.
- Wave 5{-10} is in its next-to-the-last subwave, wave 4{-11}, which is in its final subwave, wave C{-12}.
Alternative Analysis.
- Wave 5{-10} is in its next-to-the-last subwave, wave 4{-11}, which is in its forst subwave, wave A{-12}.
- Wave A{-12} is in its final subwave, wave C{-13}.
Long-term Waves.
These are the waves currently in progress under my principal analysis. Each line on the list shows the wave number, with the subscript in curly brackets, the traditional degree name, the starting date, the starting price of the S&P 500 E-mini futures, and the direction of the wave.
- S&P 500 Index:
- 5{+3} Supercycle, 7/8/1932, 4.40 (up)
- 5{+2} Cycle, 12/9/1974, 60.96 (up)
- 5{+1} Primary, 3/6/2009, 666.79 (up)
- 5{0} Intermediate, 12/26/2018, 2346.58 (up)
- S&P 500 Futures
- 5{-1} Minor, 10/27/2023, 4127.25 (up)
- 3{-2} Minute, 10/27/23, 4127.75 (up)
- 3{-3} Minuette, 10/27/23, 4127.75 (up)
- 5{-4} Subminuette, 4/18/2024, 4963.50 (up)
- 5{-5} Micro, 8/5/2024, 5120 (up)
- 1{-6} Submicro, 8/5/2024, 5120 (up)
- 3{-7} Minuscule, 8/7/2024, 5182 (up)
- 5{-8} (unnamed), 9/6/2024, 5394 (up)
- 5{-9} (unnamed), 10/2/2024, 5724 (up)
- 5{-10} (unnamed), 11/4/2024, 5824.25 (up)
- 4{-11} (unnamed), 11/11/2024, 6053.25 (down)
Reading the chart. Price movements — waves – – in Elliott wave analysis are labeled with numbers within trending waves and letters with corrective waves. The subscripts — numbers in curly brackets — designate the wave’s degree, which, in Elliott wave analysis, means the relative position of a wave within the larger and smaller structures that make up the chart. R.N. Elliott, who in the 1930s developed the form of analysis that bears his name, viewed the chart as a complex structure of smaller waves nested within larger waves, which in turn are nested within still larger waves. In mathematics it’s called a fractal structure, where at every scale the pattern is similar to the others.
Learning and other resources. Elliott wave analysis provides context, not prophecy. As the 20th century semanticist Alfred Korzybski put it in his book Science and Sanity (1933), “The map is not the territory … The only usefulness of a map depends on similarity of structure between the empirical world and the map.” And I would add, in the ever-changing markets, we can judge that similarity of structure only after the fact.
See the menu page Analytical Methods for a rundown on where to go for information on Elliott wave analysis.
By Tim Bovee, Portland, Oregon, November 15, 2024
Disclaimer
Tim Bovee, Private Trader tracks the analysis and trades of a private trader for his own accounts. Nothing in this blog constitutes a recommendation to buy or sell stocks, options or any other financial instrument. The only purpose of this blog is to provide education and entertainment.
No trader is ever 100 percent successful in his or her trades. Trading in the stock and option markets is risky and uncertain. Each trader must make trading decisions for his or her own account, and take responsibility for the consequences.
License
All content on Tim Bovee, Private Trader by Timothy K. Bovee is licensed under a Creative Commons Attribution-ShareAlike 4.0 International License.
Based on a work at www.timbovee.com.

You must be logged in to post a comment.